Google Ads and Meta reporting works best as one short weekly cross-channel report: blended spend, outcomes from one source of truth such as your CRM, each platform side by side as it reports itself, movers, wasted spend, creative fatigue, a plain-English summary and next actions. Never add the two platforms' conversions together: Google Ads defaults to a 30-day click window, Meta to 7-day click and 1-day view, and each counts on its own.
TL;DR
What it is: one short weekly report that puts Google Ads and Meta side by side, says what changed and lists the next actions. It is written for a client or manager, not for you.
The rule that matters most: never add Google Ads and Meta conversions together. Google defaults to a 30-day conversion window, Meta's standard setting is 7-day click and 1-day view, and each platform counts on its own, so the same sale can be claimed twice.
What you can blend: spend, always. Leads or revenue only from one source of truth, such as your CRM, store or GA4.
Claude's part: pull both platforms through Google's Ads MCP server and Meta's ads MCP server, check the totals, then draft. A person approves before anything is sent.
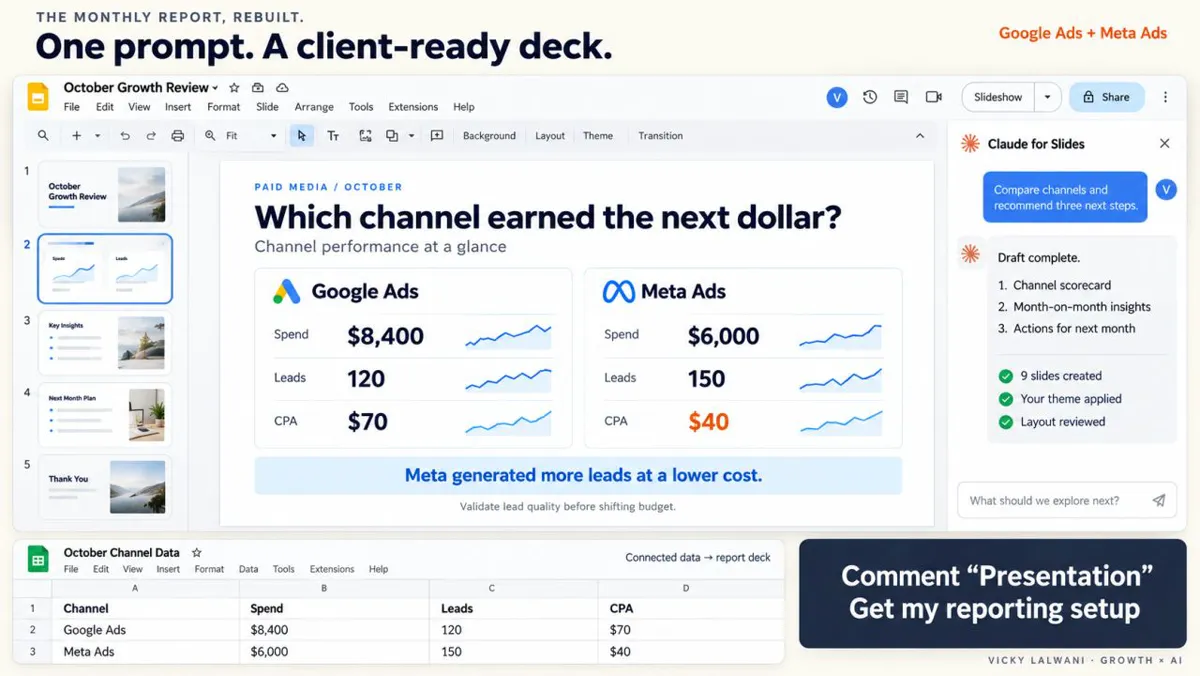
Related: the daily version for your own eyes is the Claude morning briefing; the monthly client deck is PPC reporting in Google Slides.
To report Google Ads and Meta Ads together, put both platforms in one table with the same metrics, blend only spend, take leads or revenue from one source of truth, and add the movers, the waste and a short plain-English summary. Claude can draft it every week from connector data, as long as a person checks the totals and approves it. If you want this built on top of tracking you can trust, that is my analytics and tracking work.
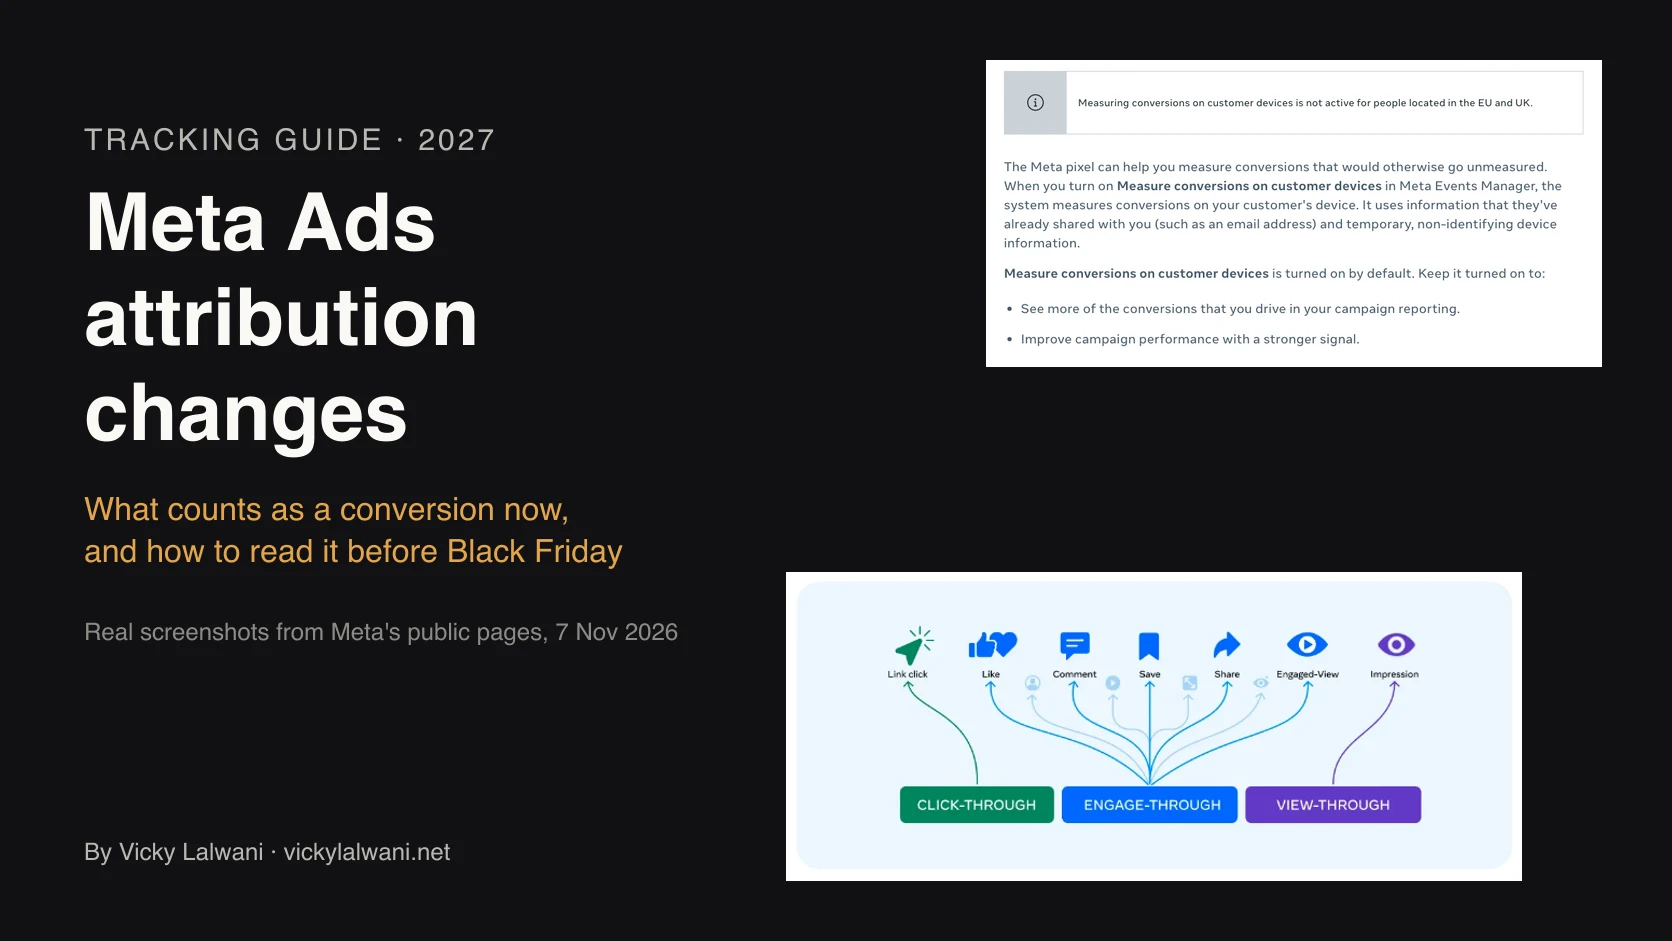
New: Meta has changed what it counts several times since 2025, including link-click-only attribution and a default-on setting that measures conversions on customer devices. Before you compare this year with last, read Meta ads attribution changes.
How this was checked. Platform facts come from Google Ads Help, Google Analytics Help, Meta's Business Help Centre and developer pages, read on 17 and 18 November 2026. Numbers in the GIFs and examples are illustrative, not client results.
What should a Google Ads and Meta Ads report answer?
Short answer: Three questions, in this order: what happened across both platforms, what changed and why, and what we are doing about it next week. A report that answers those in a page beats a dashboard with every metric that nobody opens.
The data has never been the hard part; both platforms hand it over. The pain is the plumbing in between. One agency analyst on r/PPC put it well: reporting got worse every year as "proper" tools arrived, with time now spent debugging connectors, explaining why numbers do not match the platform, and paying for dashboard seats nobody logs into.
So before you rebuild anything, be clear about the job. For most clients and managers it is communication, not exploration. If someone truly uses your dashboard to explore, keep it. Just stop expecting it to explain last week.
| Output | Reader | Cadence | Job |
|---|---|---|---|
| Cross-channel report (this article) | Client or manager | Weekly | What happened, why, what next |
| Morning briefing | You | Daily | What needs action today |
| Monthly PPC deck | Client | Monthly | Results and next month's plan |
| Executive dashboard | Leadership | On demand | Top-line numbers to explore |
Why don't Google Ads and Meta numbers match?
Short answer: Because they measure on different clocks and rules. Google Ads credits conversions up to 30 days after a click by default and dates them to the click; Meta's standard setting credits 7 days after a link click plus 1 day after a view; and each platform only knows its own ads, so both can claim the same sale.
Neither platform is lying. They are answering different questions with different settings, and a report that ignores that will mislead whoever reads it.
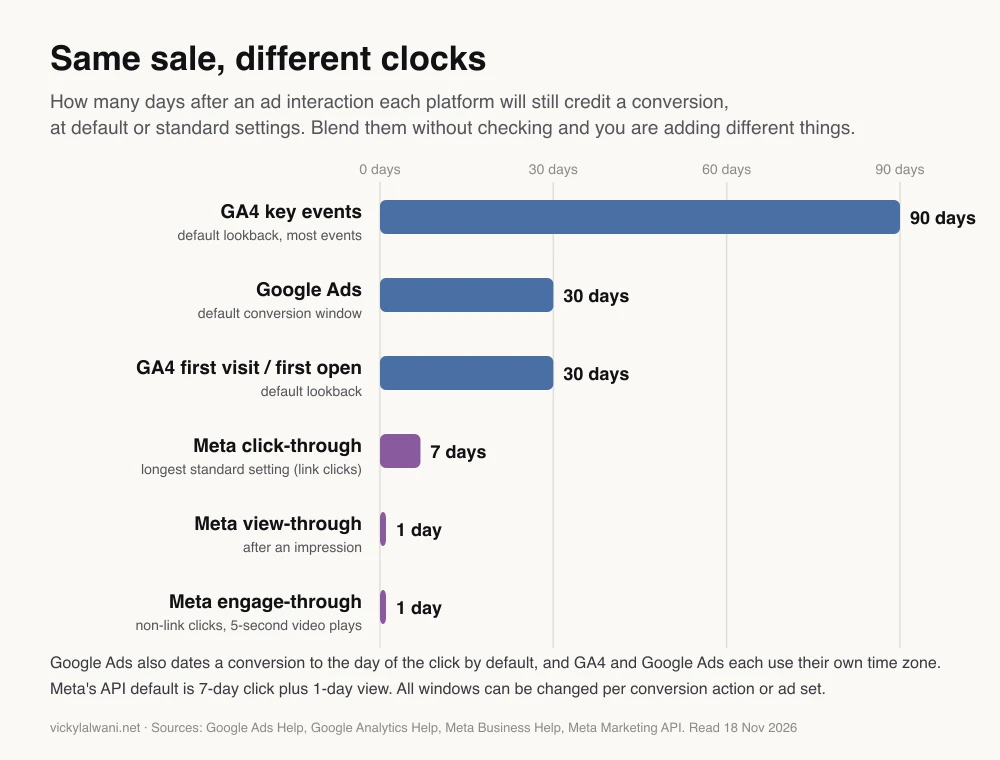
| Setting | Google Ads | Meta |
|---|---|---|
| Click window (default) | 30 days | 7 days, link clicks only |
| What a click is | An ad click | A link click (since Mar 2026) |
| View credit | Check per campaign type | 1 day after an impression |
| Date a sale is shown | Day of the click | Check your report settings |
| Time zone | Ads account | Ad account |
| Counts the other platform? | No | No |
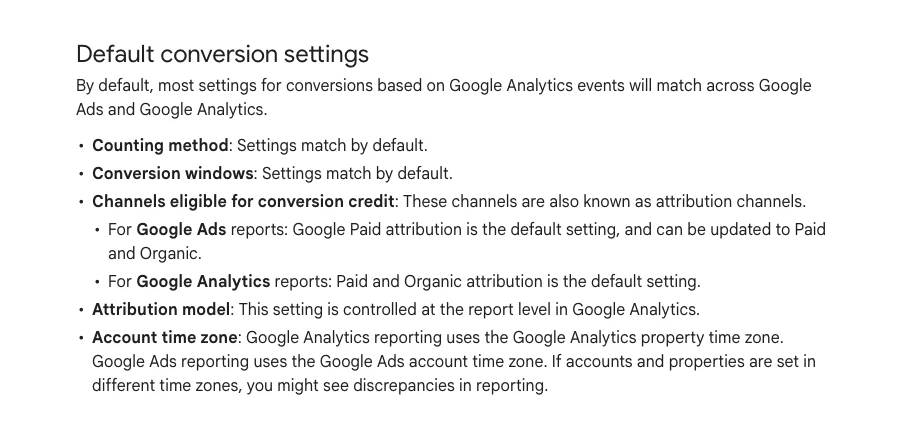
A few details catch even experienced teams. Google Ads has always reported conversions on the date of the click; separate "by conv. time" columns show them on the day they happened, which is closer to how a CRM counts. In GA4, Google Ads reports default to Google paid channels attribution while GA4 reports default to paid and organic, and different time zones between the two cause discrepancies.
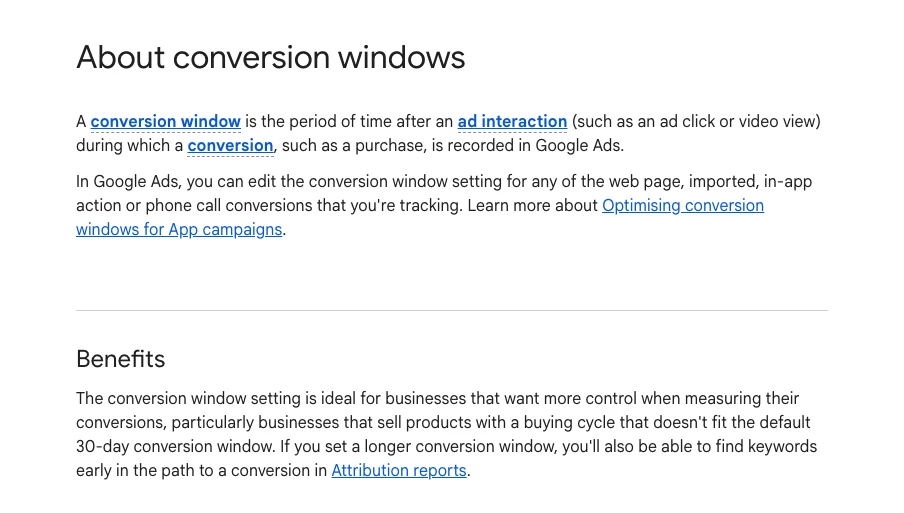
On Meta, three changes matter for any trend line. Since March 2026 a "click" for website conversions means a link click only; likes, shares and saves moved to a new engage-through category. The Ads Insights API stopped returning 7-day and 28-day view windows on 12 January 2026. And a pixel setting that measures conversions on customer devices is on by default where available (not for people in the EU or UK), which changes what Meta can count but not how it credits it.
Can you blend Google Ads and Meta ROAS?
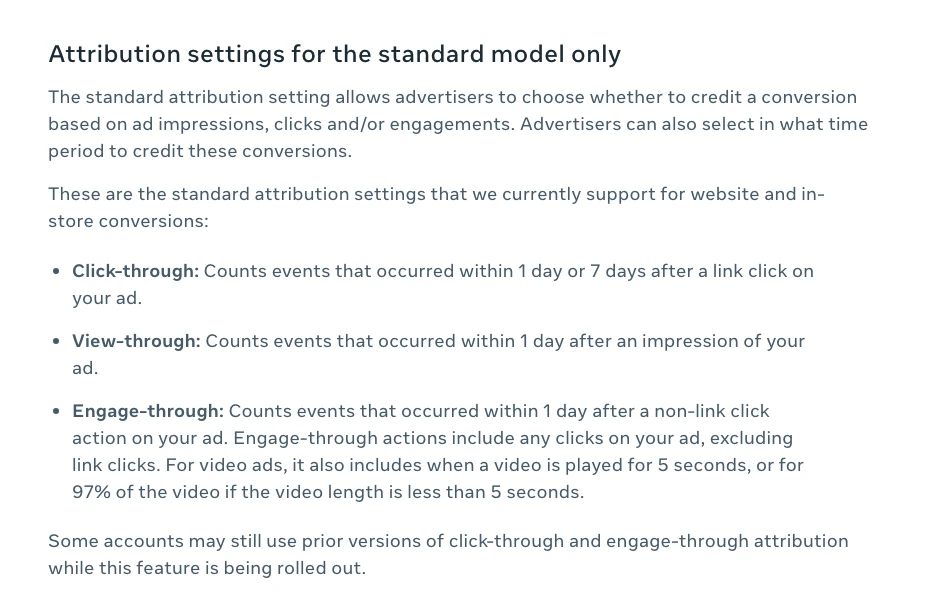
Short answer: Blend spend freely, but never blend the platforms' own conversions or revenue. A trustworthy blended ROAS or cost per lead uses total spend over outcomes from one independent source, such as your CRM, store or GA4, and says which source it used.
Here is why the summed row fails, with illustrative numbers. Google Ads reports 120 leads for the week. Meta reports 90. The sum, 210, looks like a great week. The CRM shows 160 new leads.
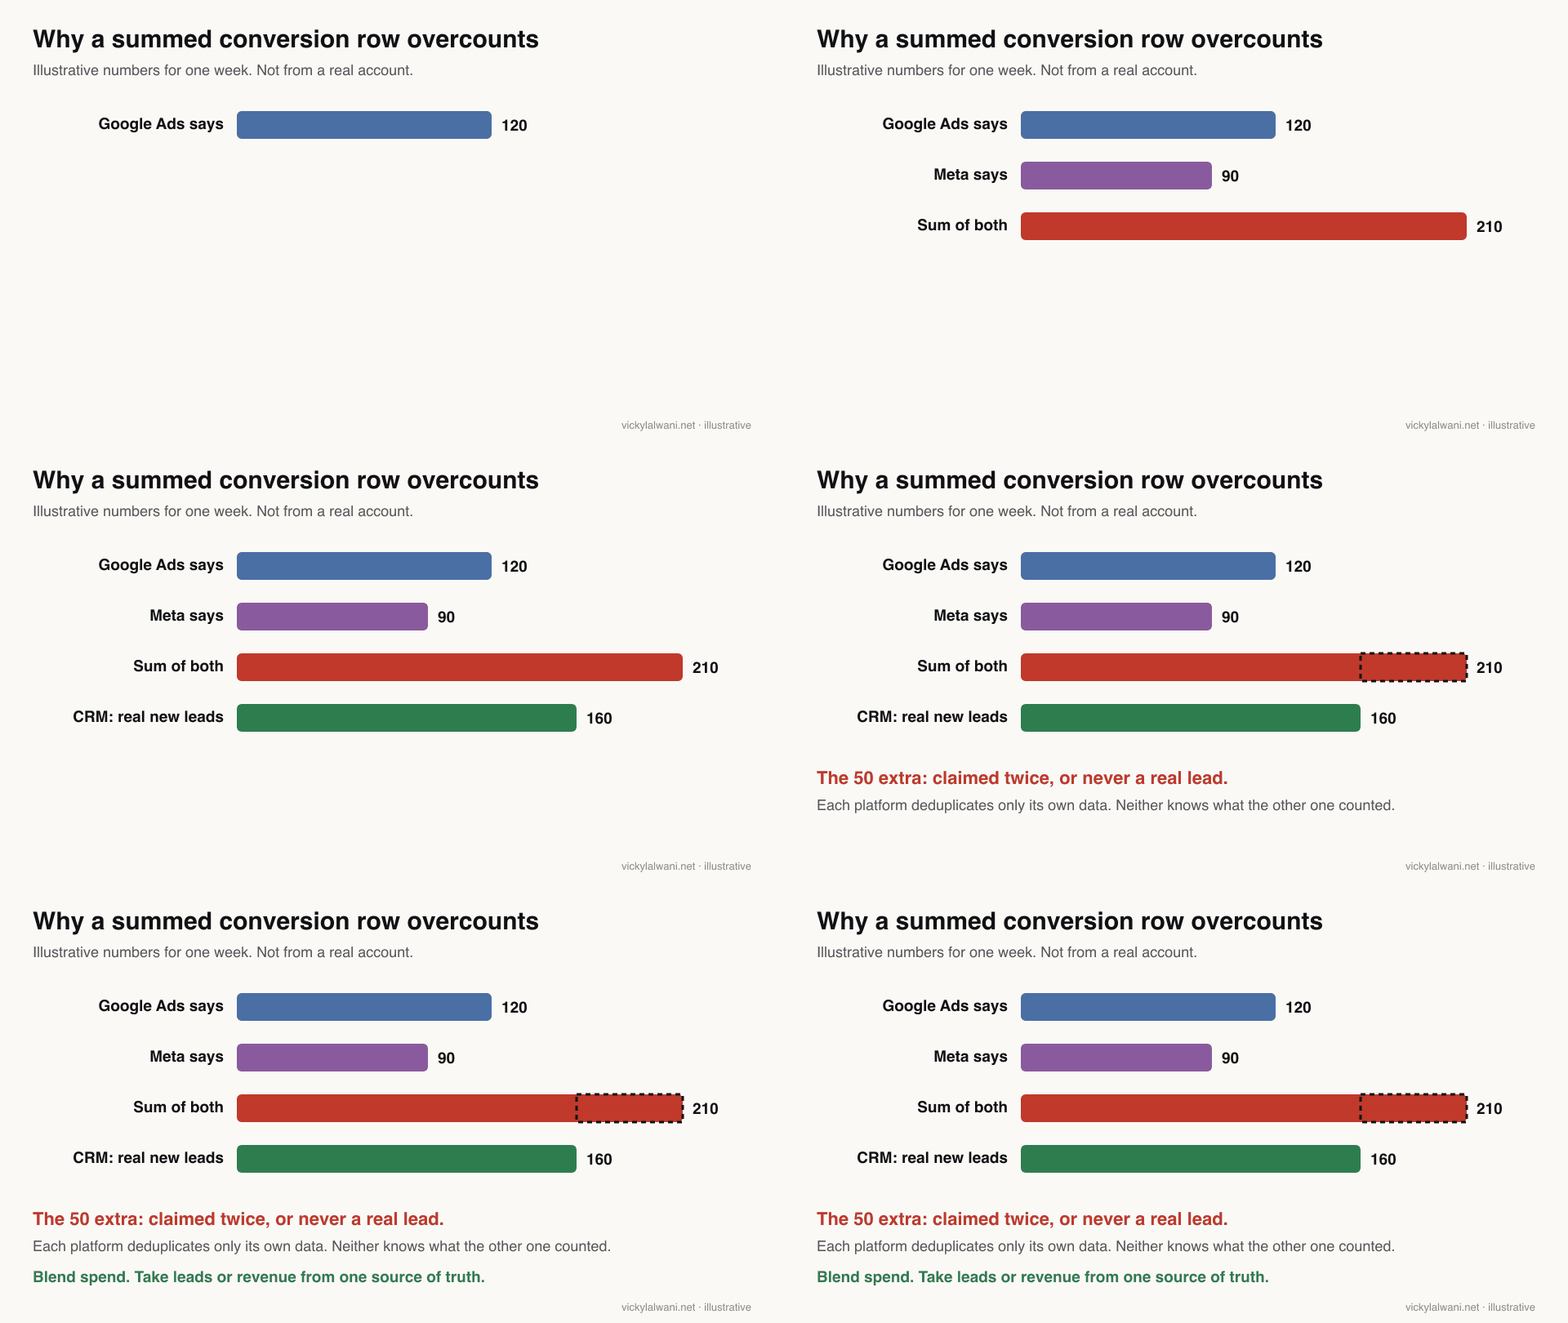
The extra 50 are leads both platforms claimed, or conversions that never became real leads. Meta deduplicates its own pixel and server events and warns that without it you "may see artificially high conversion numbers", but no platform deduplicates against another platform's claims.
| Metric | Blend it? | How |
|---|---|---|
| Spend | Yes | Add both, same currency |
| Clicks, impressions | With care | Different meanings |
| Platform conversions | No | Show side by side |
| Leads or revenue | Yes, from one source | CRM, store or GA4 |
| Blended ROAS or MER | Yes | Revenue from one source / total spend |
| Blended cost per lead | Yes | Total spend / CRM leads |
MER, or marketing efficiency ratio, is simply total revenue divided by total ad spend. It is blunt, which is the point: nobody can game it by changing an attribution window.
My own habit is to reconcile tracked conversions against the CRM before any report goes out. Problems in calls usually start there: analytics shows zero leads while the CRM shows dozens, or leads that arrived from somewhere else entirely end up credited to Google Ads.
If you do blend in a tool like Looker Studio, watch the join. A r/LookerStudio thread shows a common trap: blending on date and summing cost plus amount spent dropped every day before the second platform started spending. Missing days must count as zero, not as gaps.
What are the seven blocks of a report people trust?
Short answer: A blended headline, both platforms side by side, week-on-week movers, wasted spend, creative fatigue, a plain-English summary and next actions tied to the numbers. Keep the same order every week so readers learn where to look.
| Block | Source | Rule |
|---|---|---|
| 1. Headline | Spend + CRM or store | One line, one outcome source |
| 2. Side by side | Each platform | Labelled "as reported by" |
| 3. Movers | Both | Only what moved, ranked |
| 4. Wasted spend | Both | Line items with totals |
| 5. Creative fatigue | Meta mostly | Delivery status and CTR trend |
| 6. Summary | Everything above | Under 100 words, no jargon |
| 7. Next actions | Blocks 1 to 5 | Each tied to a number |
The headline is the one line most people read. Total spend, outcomes from your source of truth, and cost per lead or MER. If the outcome source changed this week, say so in the same line.
Side by side shows each platform as it reports itself, in identical columns, so nobody mistakes Meta's claimed conversions for Google's.
Creative fatigue has an official signal on Meta now. When an audience has seen the same creative too often, the Delivery column shows Creative limited or Creative fatigue, based on recent exposures and cost per result. It only covers ad sets with one creative, so keep a CTR trend for the rest.
The summary follows the short note I put on every report: where we are, what we are doing, what is next. Next actions matter more than they look; when each one points to a figure, the report turns into a plan, and next week starts by checking whether those moves worked.
How do you draft the report with Claude?
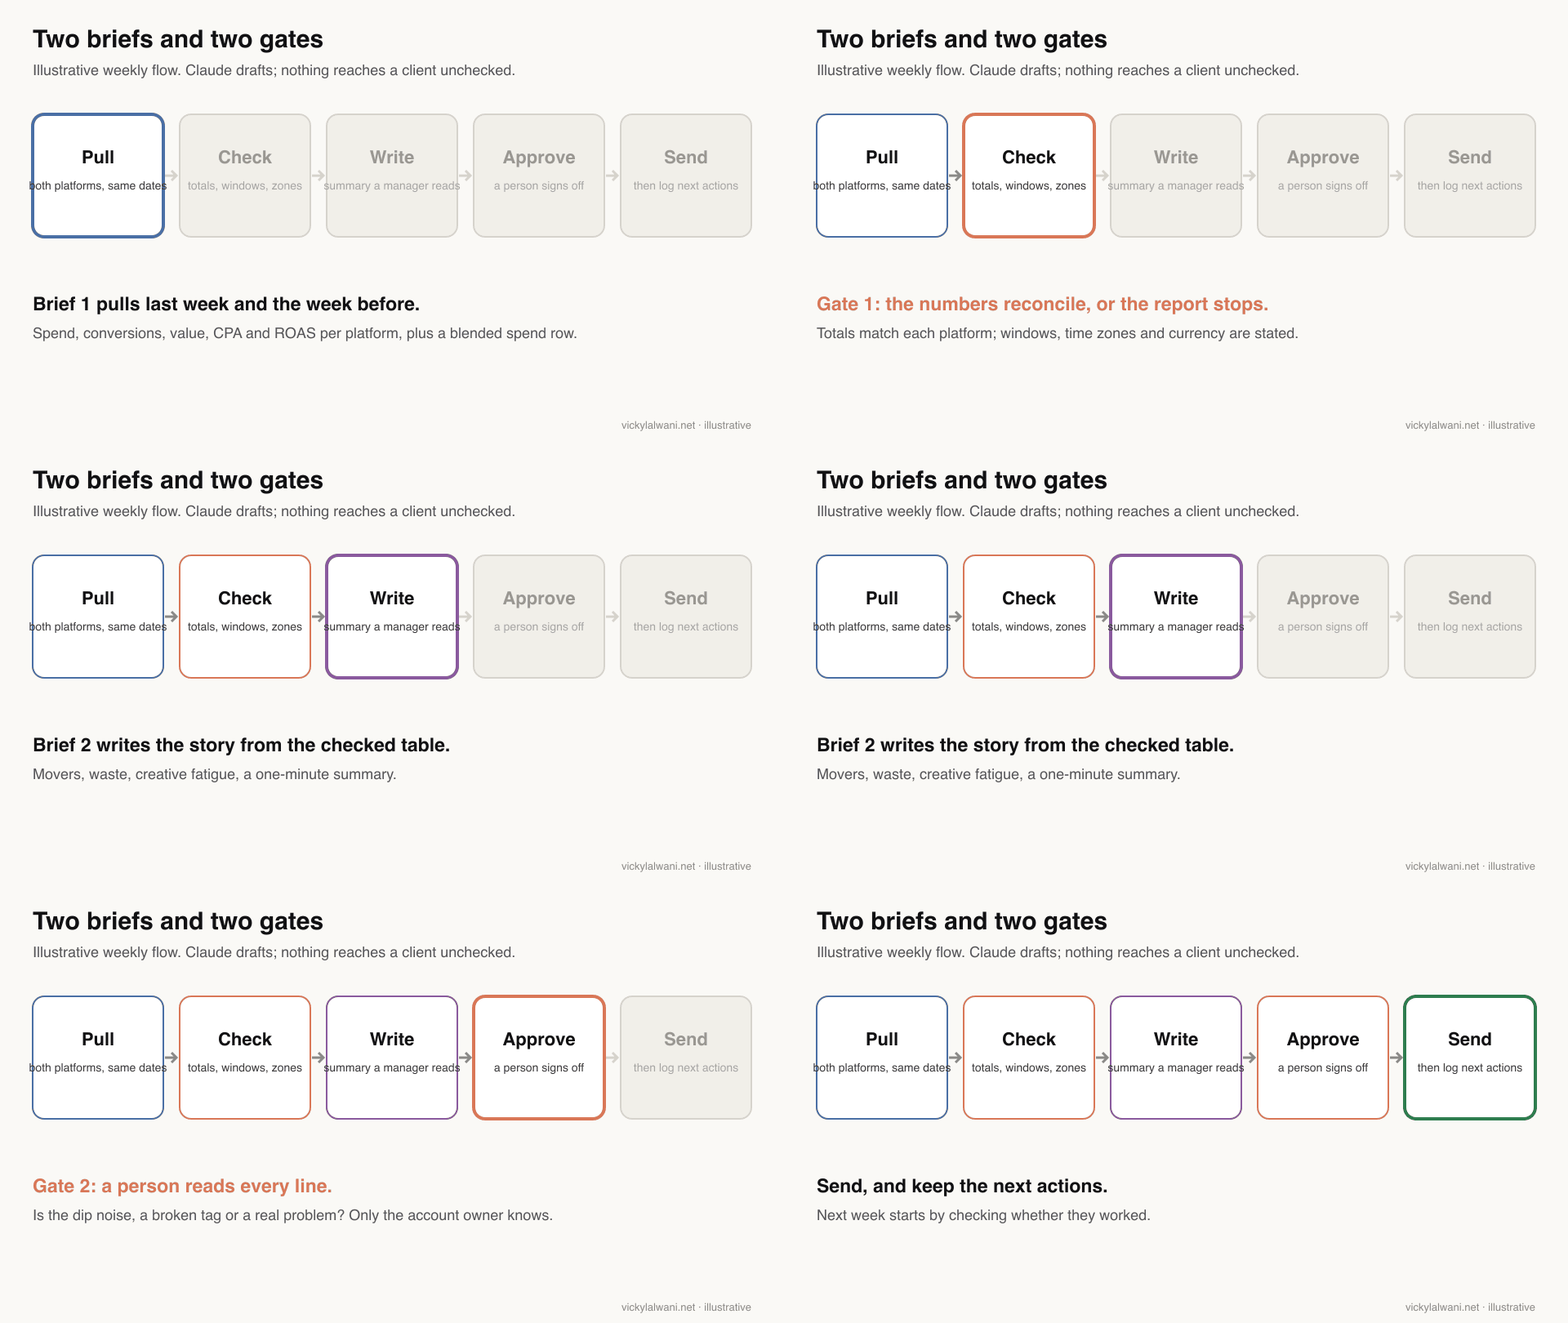
Short answer: Split it into two briefs: one that pulls and checks the numbers, and one that writes the story from the checked table. Connect both platforms read-only, run an audit prompt against the draft, and keep a person between the draft and the client.
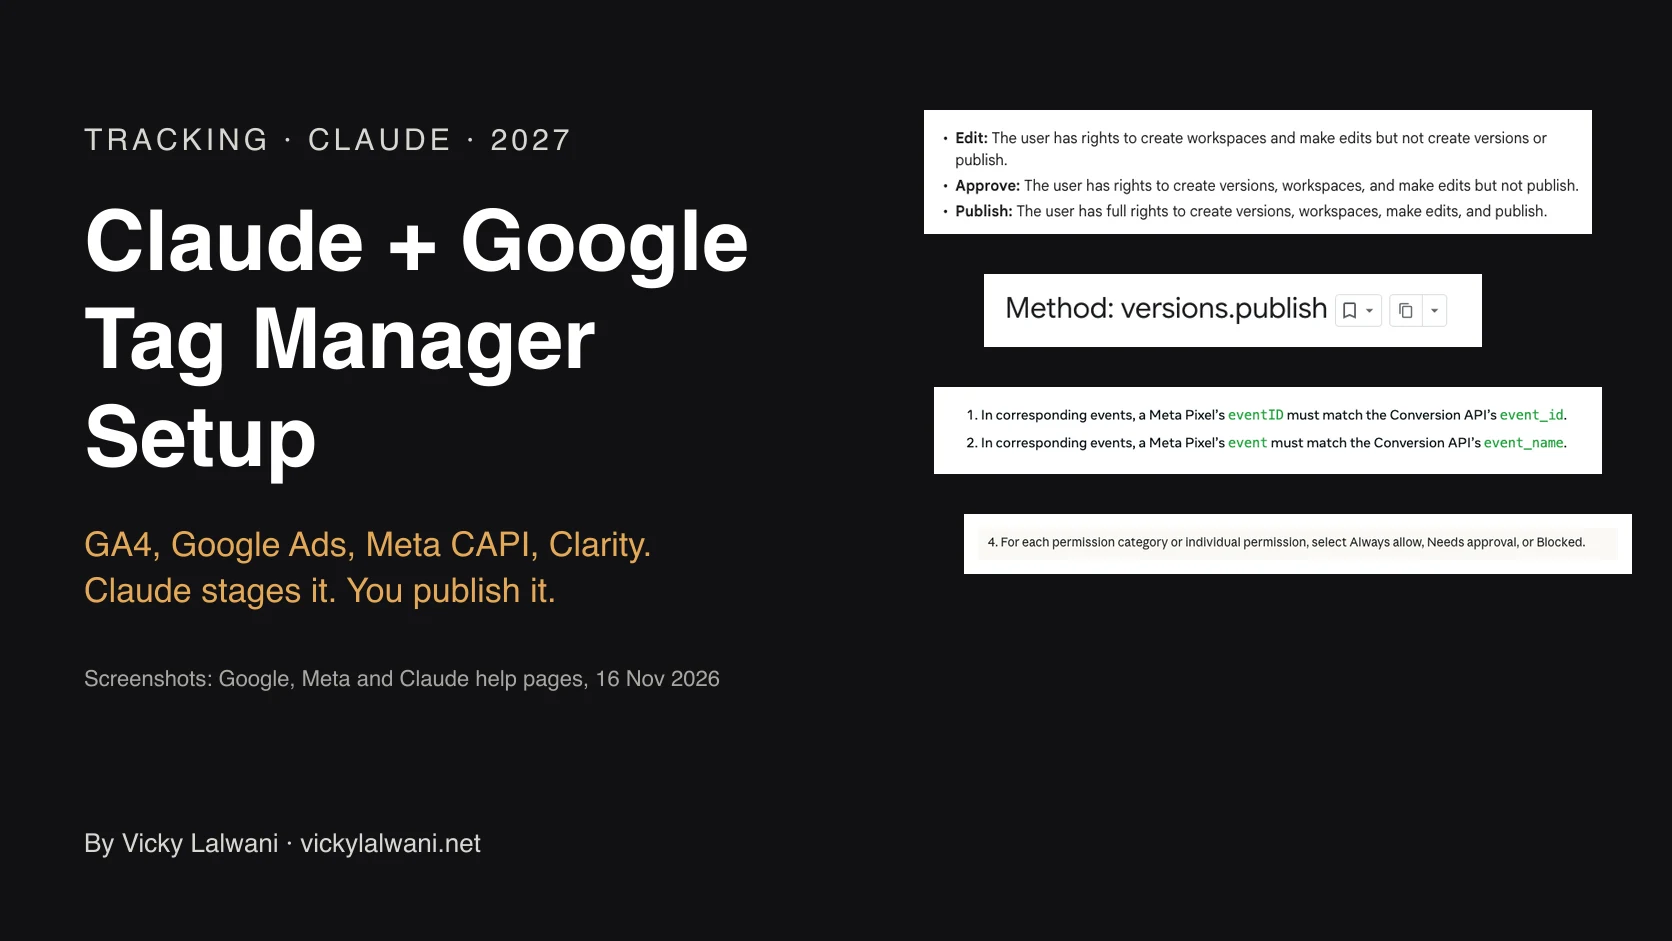
For the data, both platforms now publish their own connectors. Google's Google Ads MCP server reads accounts with GAQL queries; it gained its first write tools, for assets and labels behind a propose and confirm step, in version 0.0.6 on 2 November 2026. Meta launched its ads AI connectors in open beta on 29 April 2026, built on a Meta-hosted MCP server that covers reporting as well as creating and editing campaigns. Google's Analytics MCP server can supply the GA4 side, read-only by default.
| Data | Connector | Writes? |
|---|---|---|
| Google Ads | Google Ads MCP server | Assets, labels after confirm |
| Meta Ads | Meta ads MCP server | Yes, unless rules block it |
| GA4 | Analytics MCP server | Off by default |
| CRM or store | Its own connector or export | Read-only for reports |
Brief one: the pull. Get both weeks side by side and print the settings that make the numbers comparable, before any analysis.
Pull last week (Monday to Sunday) and the week before for Google Ads and Meta. Use only the connected data. Do not change anything in either account.

For each platform: spend, impressions, clicks, conversions, conversion value, cost per conversion and ROAS, by campaign and in total.
Then add one blended row for SPEND ONLY.

Before any analysis, print a "settings" block:
- Google Ads: conversion actions included, conversion window, account time zone, currency
- Meta: attribution setting per ad set (and any ad sets on a different model), ad account time zone, currency
If time zones or currencies differ, say so in the first line.

Flag any campaign that moved more than 15% week on week, with both figures.
Output a table only. No commentary yet. Label this a DRAFT.
Brief two: the reading. Only once the table is right. A well-written summary of a wrong table is the most dangerous thing you can send.
Using only the checked table above, write the weekly report:
1. Headline: total spend, leads or revenue from [CRM / store / GA4], cost per lead or MER. One line.
2. Platform side by side: each platform's own figures, labelled "as reported by Google Ads" and "as reported by Meta".
3. Movers: the three biggest changes by impact, each with its number.
4. Waste: spend with no conversions (keywords, ad sets, placements), with totals.
5. Creative: Meta ads showing "Creative limited" or "Creative fatigue", and any ad whose CTR fell for two weeks running.
6. Summary: under 100 words, no jargon, for someone who is not a marketer.
7. Next actions: three to five, each tied to a number above.
Never add the two platforms' conversions together. Mark any cause as "to check".
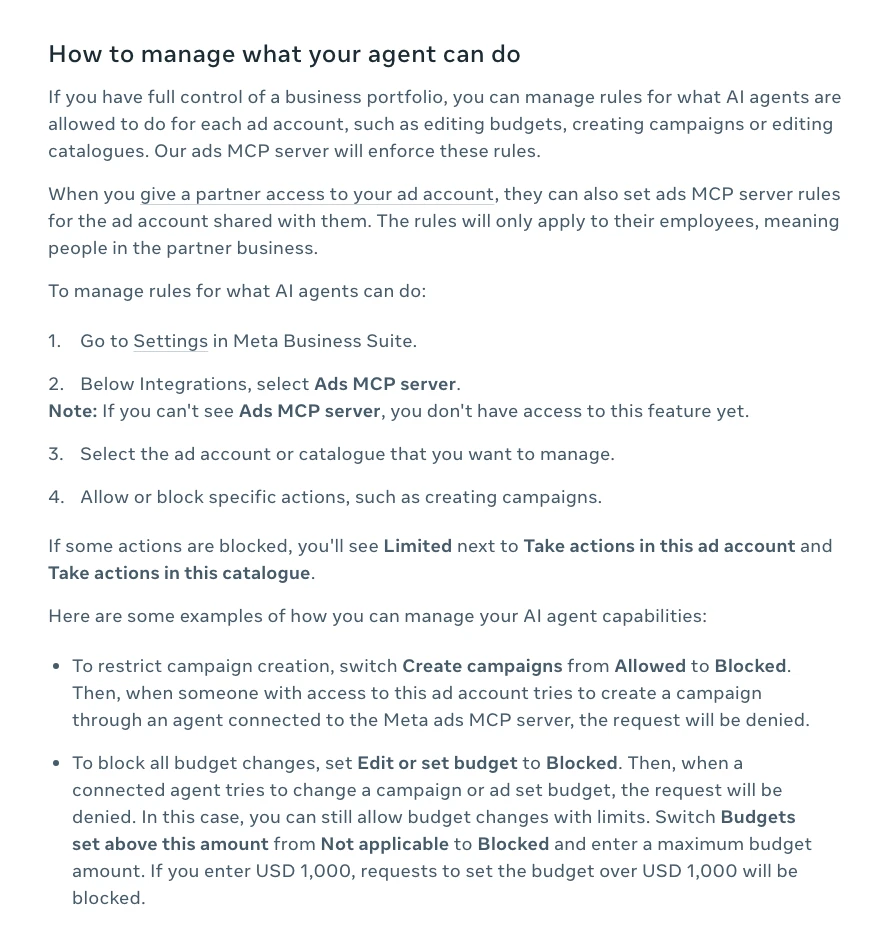
A reporting job never needs write access, so block it. Meta lets anyone with full control of a business portfolio block agent actions such as creating campaigns or editing budgets in Meta Business Suite settings, under Integrations. Practitioners testing Meta's server in June reported that reading data was fine but worried about write access, which is another reason to switch it off for reporting.
To have the draft waiting on Monday, save the briefs as a skill and run them as a weekly Claude scheduled task. The morning briefing guide covers which scheduling option to use and how to keep a scheduled run read-only, so I will not repeat it here. Having worked across $1.3M+ a year in ad spend, I would rather spend Monday deciding what the numbers mean than assembling them.
What should you check before sending?
Short answer: That totals reconcile with each platform, no conversion figure is a sum of both platforms, windows, time zones and currencies are stated and consistent, every claim points to a real row, and nothing from another client has leaked in. Claude can run this audit on its own draft; you still read it.
| Check | How | If it fails |
|---|---|---|
| Totals reconcile | Match each platform's total | Stop and re-pull |
| No summed conversions | Search the headline | Use one outcome source |
| Windows stated | Settings block in the draft | Add them or do not blend |
| Time zone, currency | Compare both accounts | Convert and say so |
| Claims trace back | Each mover has a row | Delete the claim |
| Nothing leaks | Scan names and figures | Remove and re-check |
Audit the draft report against the source tables. List only failures and the fix. Do not rewrite anything that passes.
- Does each platform total match that platform's own total?
- Is any conversion or revenue figure a sum of Google Ads and Meta? (That is a failure.)
- Are windows, time zones and currencies stated, and do they match the settings block?
- Does every mover and waste flag point to a real row?
- Is there any name, figure or detail from another client or account?
Automation does not make a report trustworthy. A clean layout looks authoritative whether or not the numbers are right, so the checks matter more once a machine is drafting.
Where does your judgement still matter?
Short answer: In deciding what the client sees: which movers matter, whether a dip is noise, seasonality or a broken tag, and what the next actions should be. The pull, the maths and the first draft can be handed to Claude; the reading of the account cannot.
A one-week drop during a seasonal lull and a one-week drop after a broken tag can look identical in a table. Only someone who knows the account can tell them apart, and that is the judgement a client pays for.
Practitioners land in the same place. The top reply in an r/PPC thread on managing Google and Meta with Claude Code says Claude should be the analyst, not the buyer, with a human approving every change. When I run platforms side by side, the decision to cut one at a set date stays with a person who has read the numbers, not with the tool that produced them.
A sensible test is to run the new report alongside your current one for a few weeks. Compare which one your client responds to, then decide what to cancel.
What people say on X and Reddit
Short answer: Practitioners agree that platform numbers will never match GA4 or each other, and argue about which window or model is least misleading. On Reddit, the recurring complaints are connectors that break, blends that drop days, and fear of giving AI tools write access.
Each post below was checked through X's embed service, and each Reddit thread through the Arctic Shift archive, on 18 November 2026. Accounts named after a person are described by type.
| Post | Who | Date | Type |
|---|---|---|---|
| Standard 7-day click, 1-day view over-credits Meta on email days | A DTC growth practitioner | 31 Jan 2026 | Opinion, first-hand |
| Google Ads and GA4 revenue differ; both are right | A Google Ads freelancer | 4 Jun 2026 | First-hand |
| 1-day Meta window matches third-party tools better | An agency ad buyer (Japanese) | 25 Jun 2025 | Opinion |
| Google Ads multi-source conversions (beta) help page | Search Engine Roundtable's editor | 16 Sep 2026 | Reporting |
| Meta gives Claude official ads access (launch summary) | An AI tips account | 11 May 2026 | Secondary |
| Thread | Community | Date | Type |
|---|---|---|---|
| Client reporting is the only part that got worse | r/PPC | 23 Mar 2026 | First-hand |
| Best ways to get ad data into Claude without bans | r/PPC | 2 Apr 2026 | First-hand, mixed |
| Tested Meta's MCP: reading fine, writing risky | r/PPC | 3 Jun 2026 | First-hand |
| Blending Meta and Google drops days | r/LookerStudio | 11 Aug 2026 | First-hand question |
In the r/PPC data thread, an agency asks how to get ad data into Claude without risking Meta bans. Replies split between middleware with official API integrations, plain CSV imports, and server-side tracking, and one reminder gets repeated: platform figures and GA4 will differ "even just between GA4 and Google Ads". Meta's own help page now says using its ads MCP server on its own is unlikely to get an account banned.
The Meta MCP test is one person's experience from June, including accounts not yet enabled for the server; treat its figures as an anecdote, not a measurement.
Videos worth watching
Short answer: Start with Google's own session on attribution, incrementality and media mix models, then a short explainer on why Meta and GA4 disagree. The third is Google's introduction to its Ads MCP server, which is how Claude reads the Google side.
Google Ads (official channel), 2 September 2026. A 30-minute session on the three ways to measure. Sells Google's measurement tools.
An analytics consultant's channel, 17 June 2025. Nine minutes on attribution and tracking differences. Offers free resources and sells services.
Google Advertising and Measurement Developers (official), 29 October 2025. Four minutes on Google's open-source server. Nothing sold.
| Video | Channel | Date | What it covers |
|---|---|---|---|
| Attribution, incrementality and MMM | Google Ads (official) | 2 Sep 2026 | Measurement options |
| Why Meta and GA4 don't match | Analytics consultant | 17 Jun 2025 | Reasons for gaps |
| Introducing the Google Ads MCP Server | Google (official) | 29 Oct 2025 | Reading Ads data with AI |
| Automate Meta Ads reporting with Claude | A marketing automation vendor | 31 Mar 2026 | Meta API reports |
| Meta Ads official MCP + Claude AI | A paid ads tutorial channel | 7 May 2026 | Connecting Meta to Claude |
| Cross-channel marketing reports | A reporting tool vendor | 4 Apr 2025 | Looker Studio template |
Where this advice is weak
Short answer: Attribution settings and connectors change often, the CRM is only as good as the data people enter, and MER hides which channel did the work. Treat this as a reporting discipline, not a measurement of what each platform caused.
- A report is not an incrementality test. Meta itself calls incrementality experiments the gold standard; this report only describes what happened.
- Your CRM can be wrong too. Untracked phone calls, duplicate contacts and leads entered late all move the "one source of truth".
- MER and blended cost per lead are honest but blunt. They tell you whether the total works, not which platform to cut.
- Meta's and Google's connectors are new. Meta's server was in open beta from April 2026, and Google's gained write tools in November, so check what each can do before you connect it.
Want a second pair of eyes on your reporting?
Short answer: If your Google and Meta numbers never reconcile, the fix usually starts with tracking, not the report. I check tracking and build reporting as part of my analytics and tracking work, and manage the accounts themselves through Google Ads management and Meta ads. Rates are on the pricing page.
Related reading: the daily Claude morning briefing, the monthly PPC report in Google Slides, the executive marketing dashboard and Meta ads attribution changes.
Sources
| Source | What it supports | Date | Link |
|---|---|---|---|
| Google Ads Help | Default 30-day conversion window | Read 18 Nov 2026 | Conversion windows |
| Google Ads Help | Conversions dated to the click; by conv. time columns | 17 Oct 2019 | Conversions by time |
| Google Analytics Help | Lookback windows, default channels, time zones | Read 18 Nov 2026 | Attribution settings |
| Meta Business Help | Click, view, engage-through windows; models | Read 18 Nov 2026 | Attribution settings |
| Meta Marketing API | Default = 7-day click, 1-day view | Read 17 Nov 2026 | Insights reference |
| Meta for Business | Link-click-only click attribution | 3 Mar 2026 | Click attribution |
| Meta for Developers | 7-day and 28-day view no longer returned | 16 Oct 2025 | Insights API update |
| Meta Business Help | Customer devices setting, not EU or UK | Read 18 Nov 2026 | Customer devices |
| Meta Business Help | Deduplication; inflated counts without it | Read 18 Nov 2026 | Deduplication |
| Meta Business Help | Creative limited and Creative fatigue | Read 18 Nov 2026 | Creative fatigue |
| Meta for Business | Ads AI connectors open beta | 29 Apr 2026 | Announcement |
| Meta Business Help | Ads MCP abilities, agent rules, bans | Read 18 Nov 2026 | Meta ads AI connectors |
| GitHub (Google) | Ads MCP v0.0.6, propose and confirm | 2 Nov 2026 | google-ads-mcp releases |
| GitHub (Google) | Analytics MCP, read-only default | Read 18 Nov 2026 | google-analytics-mcp |
| X and Reddit | Practitioner views | Jun 2025 to Sep 2026 | Linked in the tables above |
FAQ
What should a Google Ads and Meta Ads report include?
A blended headline with total spend and outcomes from one source of truth, both platforms side by side, week-on-week movers, wasted spend, creative fatigue, a short plain-English summary and three to five next actions tied to the numbers.
Can you add Google Ads and Meta conversions together?
No. Each platform counts conversions with its own window and only knows its own ads, so the same sale can be claimed by both. Add spend, and take leads or revenue from your CRM, store or GA4 instead.
Why does Meta report more conversions than Google Analytics?
Meta credits conversions after views as well as clicks, uses its own attribution window, and can measure some conversions GA4 cannot see, while GA4 uses its own model and lookback. The two answer different questions, so a gap is normal; state both and explain it.
What is the default attribution window in Google Ads and Meta?
Google Ads uses a 30-day conversion window by default, editable per conversion action. Meta's standard setting is 7-day click and 1-day view, and since March 2026 a click means a link click for website conversions.
What is blended ROAS or MER?
Blended ROAS, often called MER, is total revenue divided by total ad spend across all platforms. It is only honest when the revenue comes from one independent source, such as your store or CRM, not from adding each platform's reported revenue.
Can Claude build a cross-channel ad report automatically?
Claude can pull Google Ads and Meta data through their MCP servers, calculate the comparison and draft the report on a weekly schedule. A person should check the totals and approve the report before a client sees it.
Do I still need a dashboard if I send a weekly report?
Not always. If the real need is a weekly answer on what happened and what comes next, a written report serves better. Keep a dashboard when someone actually uses it to explore the data.
How do I stop an AI connector changing my Meta ads?
Use a read-only connection for reporting, and in Meta Business Suite settings, under Integrations, set ads MCP server rules to block actions such as creating campaigns or editing budgets. The rules apply to agents using Meta's ads MCP server.