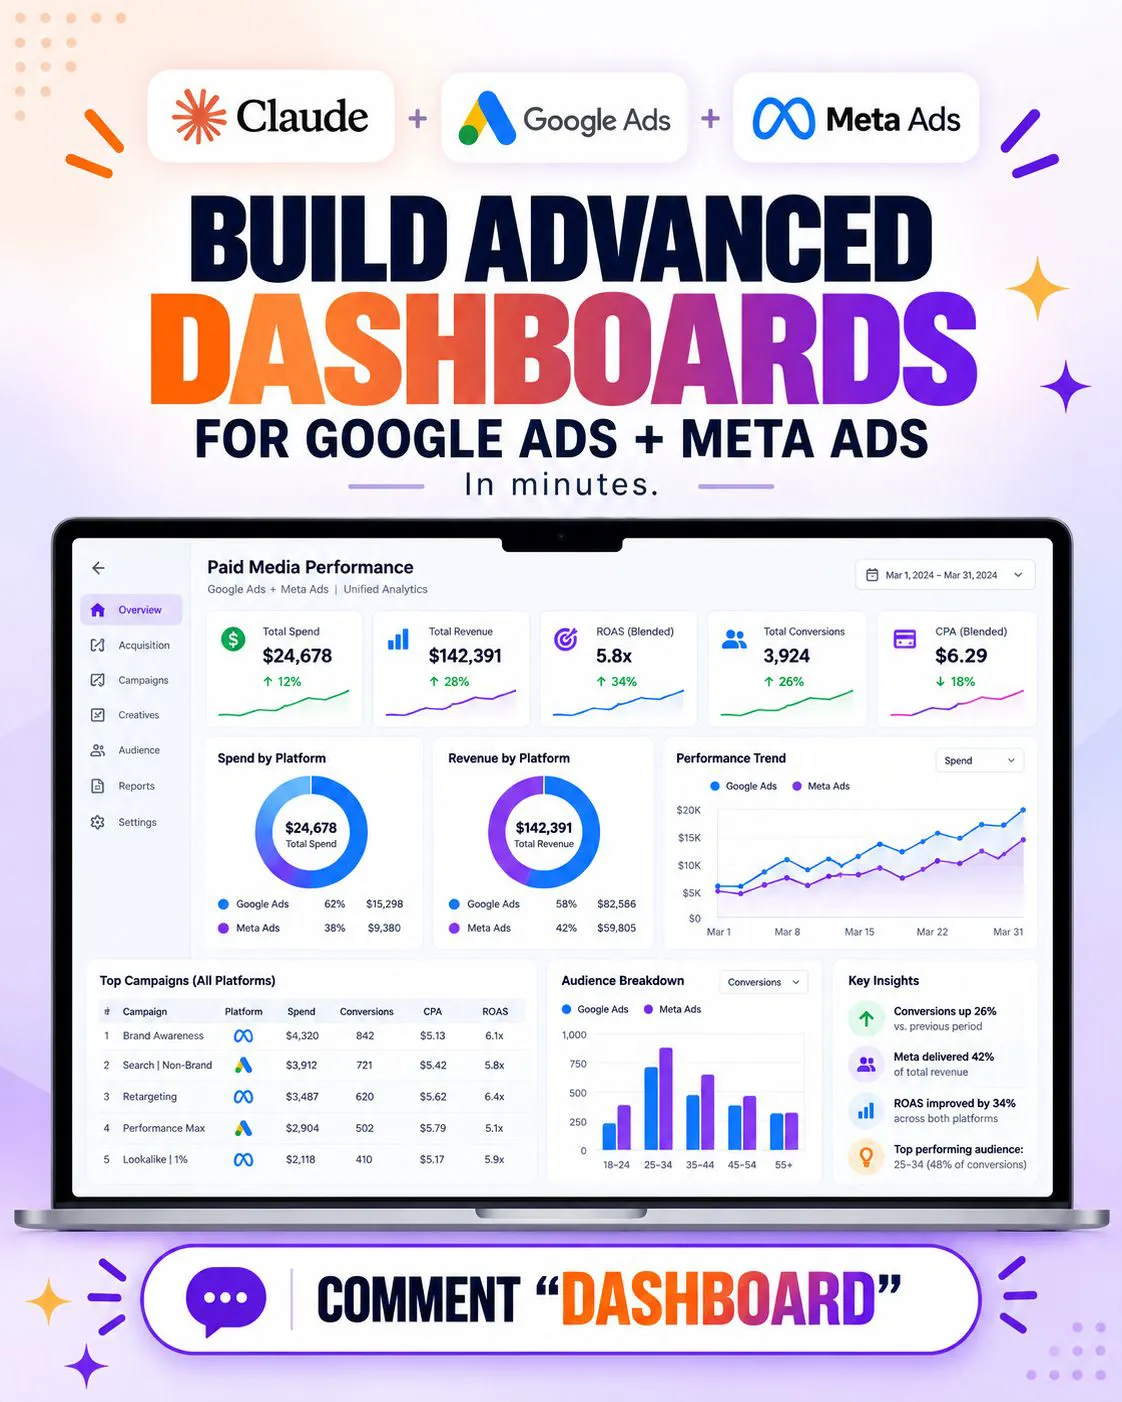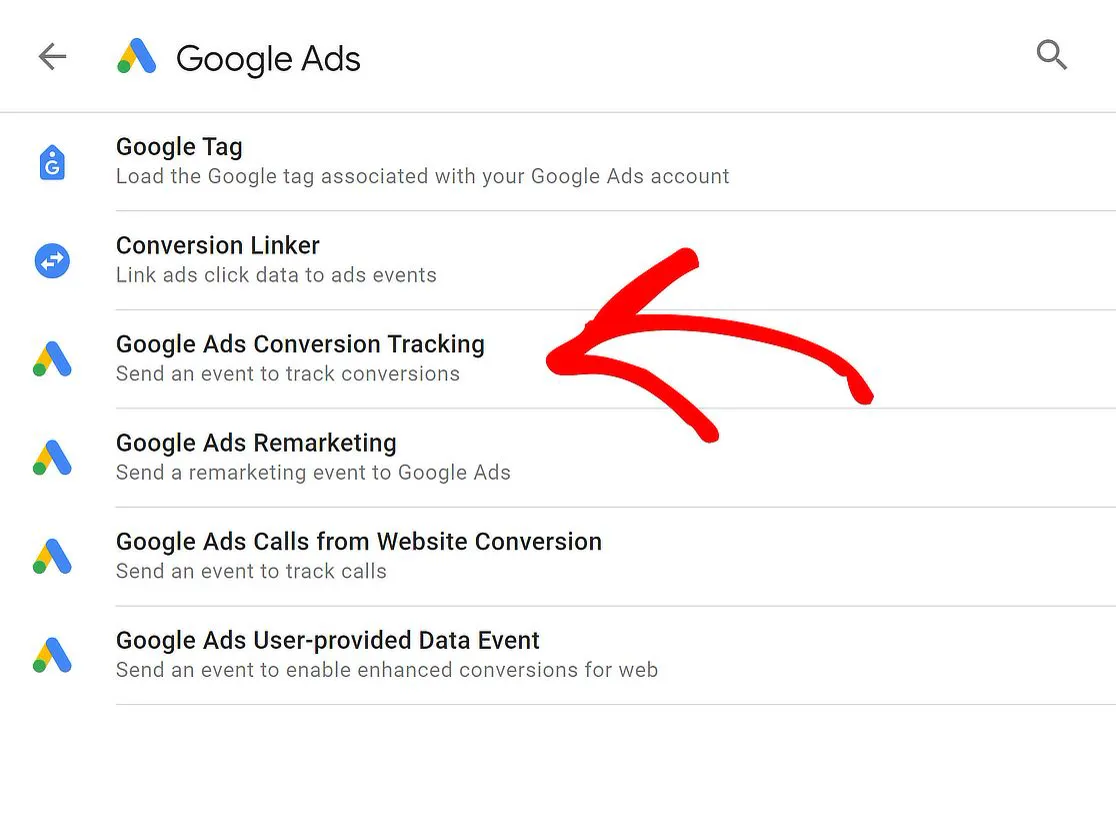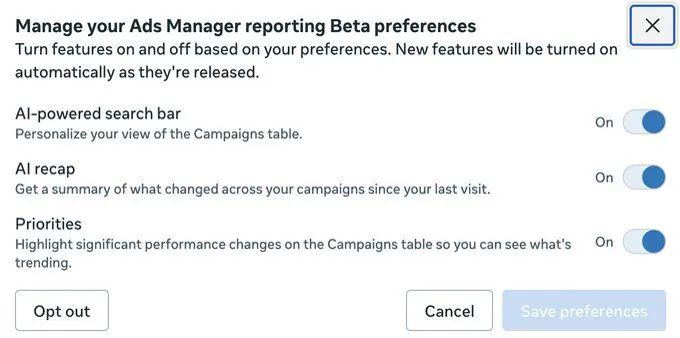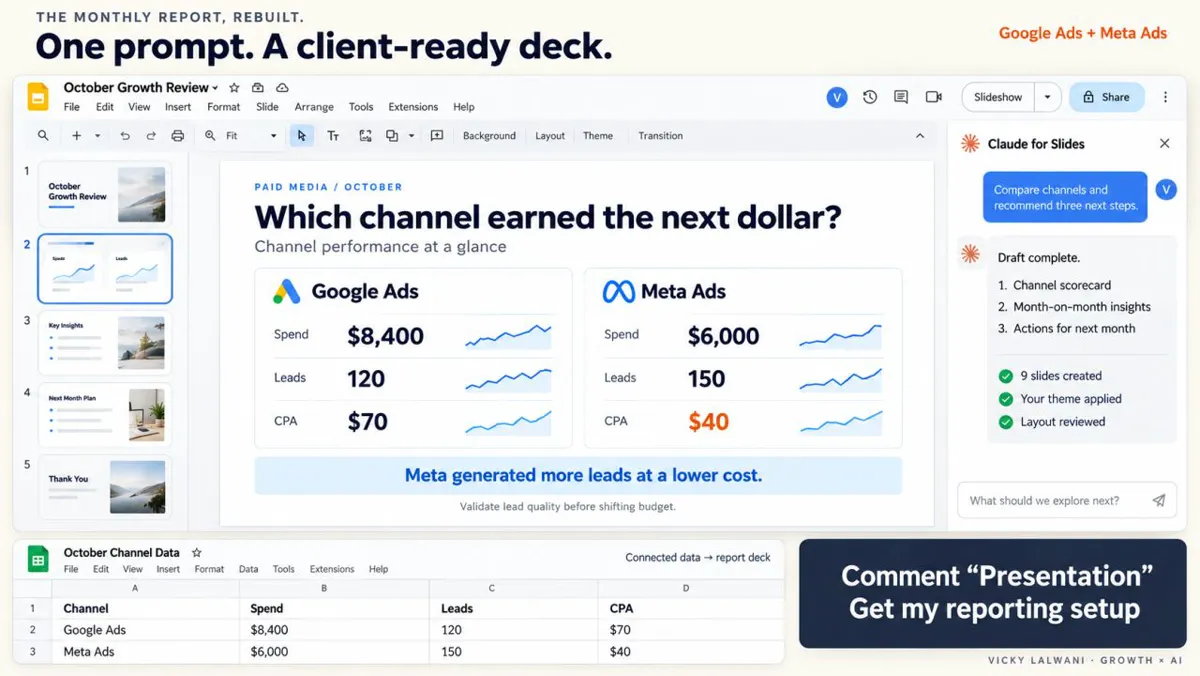
A monthly PPC report in Google Slides can be drafted by Claude for Google Workspace, Gemini in Slides, Data Studio Pro or a reporting tool. Keep the numbers in one Google Sheet, link the charts so they update, fix the slide order once and check the figures against each platform before sending.
It is the first working day of the month. Before you can think about the accounts, you have to export Google Ads and Meta numbers, paste them into a sheet, rebuild the same charts in Google Slides and work out why the conversion totals do not match. A monthly PPC report in Google Slides can now be drafted for you, by Claude, by Gemini or by a reporting connector. The judgement, the checks and the story behind the numbers are still yours. If you would rather hand the whole reporting loop to someone, that is part of my Google Ads and PPC management, and the tracking underneath it is covered by analytics and tracking setup.
TL;DR
Four routes can draft a monthly PPC deck in Google Slides in November 2026: the Claude for Google Workspace add-on (beta, paid Claude plans), Gemini in Google Slides (eligible Workspace or Google AI plans), Data Studio Pro with Gemini (preview) and paid reporting tools that fill a Slides template.
Charts are the catch. Claude and Data Studio insert charts as images, which do not update. Charts linked to a Google Sheet do, when you click Update.
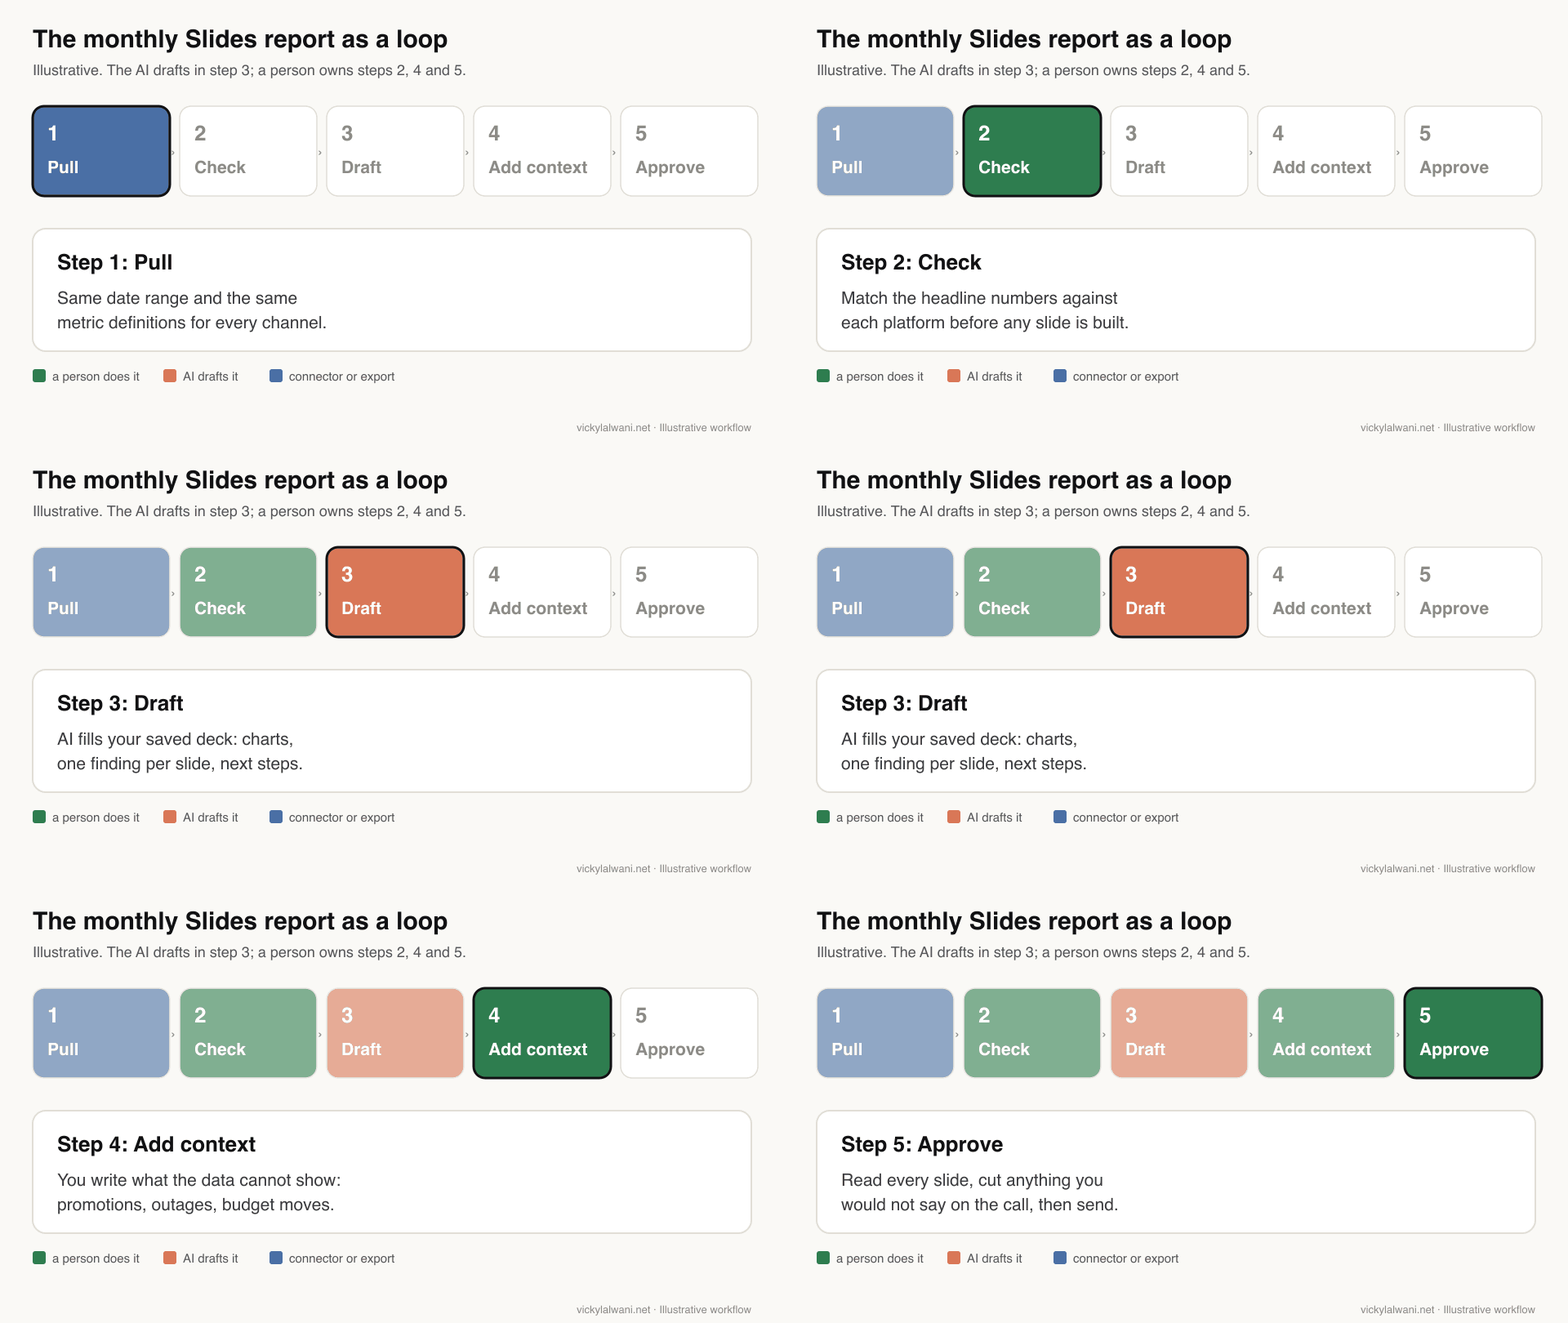
Fix the slide order and metric definitions once, save them as a skill or template, then rerun each month.
Check the headline numbers against each platform before the deck goes out. Google Ads and Meta count conversions differently, so say so on the slide.
| Route | What it does | Watch out for |
|---|---|---|
| Claude add-on in Slides | Builds slides from your deck's layouts | Charts go in as images |
| Gemini in Slides | Builds a full deck from a prompt and Drive files | Plan, language and usage limits |
| Data Studio Pro + Gemini | Turns report charts into slides with summaries | Preview; Pro licence needed |
| Reporting tool template | Fills tagged slides with fresh data | Monthly fee per account |
| Sheets + linked charts | Free; charts update on click | More manual set-up |
How this was checked: product facts come from Anthropic, Google and Meta help pages and vendor pricing pages, read on 17 and 18 November 2026. Prices are in US dollars as shown on each page and change often, so check before you buy.
What should a monthly PPC report in Google Slides include?
Short answer: Seven slides cover most accounts: a one-slide summary, results against target, a channel breakdown, what changed, what you tested, next steps and a definitions slide. Put one finding at the top of each slide, in words, above the chart.
A deck is not a dashboard. A dashboard lets someone explore. A monthly deck tells them what happened, why, and what you will do next, in the order they will read it. The structure below is the one I would start from; trim it for small accounts.
| Slide | What goes on it | Why |
|---|---|---|
| 1. Summary | Three lines: result, reason, next step | Many readers stop here |
| 2. Results vs target | Spend, conversions, CPA or ROAS | Shows if the month worked |
| 3. Channels | Google Ads and Meta side by side | Where money went |
| 4. What changed | Top movers vs last month | Explains the numbers |
| 5. Tests | What you tried and the result | Shows active management |
| 6. Next steps | Three actions with owners | Turns a report into a plan |
| 7. Definitions | Metrics, date range, attribution | Stops arguments later |
A few terms, in plain words. CPA (cost per acquisition) is spend divided by conversions. ROAS (return on ad spend) is conversion value divided by spend. A conversion is whatever action you told the platform to count, such as a lead form or a purchase.
One habit I keep on every report: a short note written by a person, saying where we are, what we are doing and what is next. AI can draft the charts. It cannot know that the client paused a product line or that the site was down for a day.
Which AI tools can build the deck in November 2026?
Short answer: Claude, through its Google Workspace add-on and Slides connector; Gemini in Google Slides; Gemini in Data Studio Pro; and reporting tools such as Two Minute Reports. All four draft slides. None of them removes the need to check the numbers.
Claude for Google Workspace
Anthropic released Claude for Google Docs, Sheets and Slides on 6 October 2026, in public beta on all paid Claude plans, according to Anthropic's launch article. In Slides, Claude can build new slides from your deck's layouts and themes, split crowded slides and restyle a deck. By default, each change appears as an approval card before it lands. You can also ask for a new Google deck from the Claude chat through the Google Workspace connectors, which are also in beta.
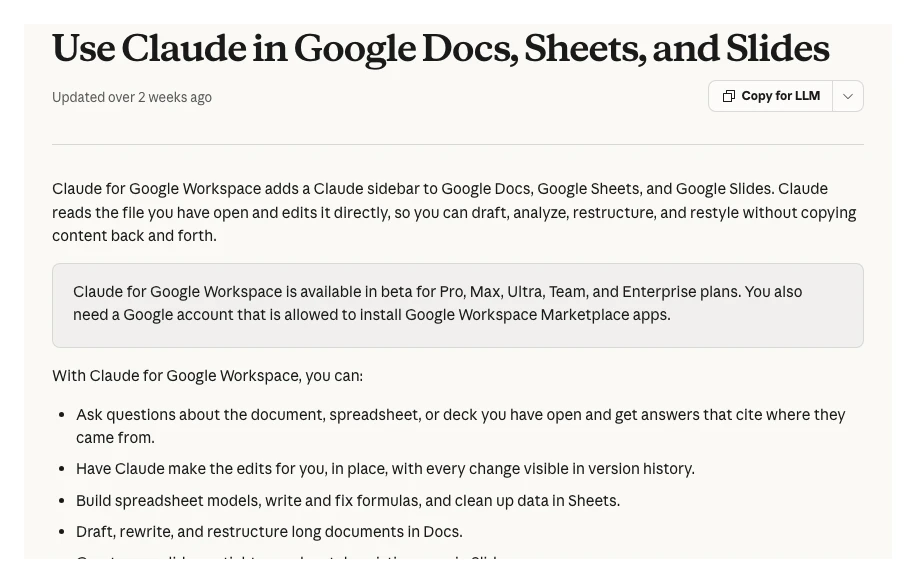
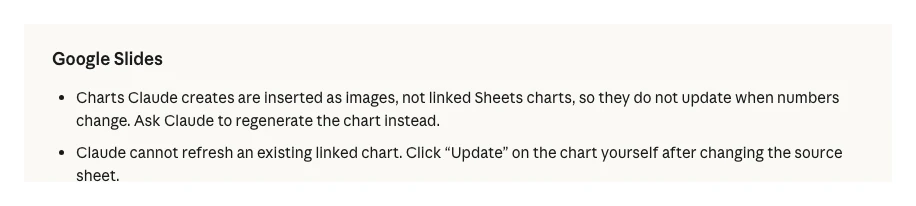
The limits matter for reporting. Anthropic's help page says charts Claude creates in Slides are inserted as images, not linked Sheets charts, so they do not update when the numbers change. Claude also cannot refresh an existing linked chart. A single long operation stops after six minutes, the sidebar must stay open, and Firefox is not supported in the beta.
Gemini in Google Slides
Since 29 June 2026, Gemini can build a full multi-slide deck from one prompt, ground it in files from Drive and match the style of another deck, according to Google's Workspace Updates post. You approve an outline first, then Gemini builds editable slides. The same post lists Business Standard and Plus, Enterprise Standard and Plus, and Google AI Pro and Ultra among the eligible plans, and says per-user usage limits apply.
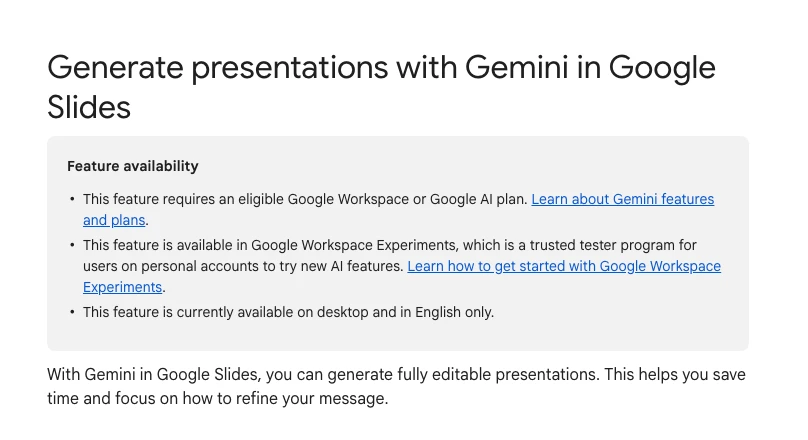
For a PPC report, Gemini's strength is pulling from files you already keep in Drive, such as last month's deck and a sheet of exported numbers. It does not connect to Google Ads or Meta by itself, so the data still has to reach Drive first.
Data Studio Pro with Gemini
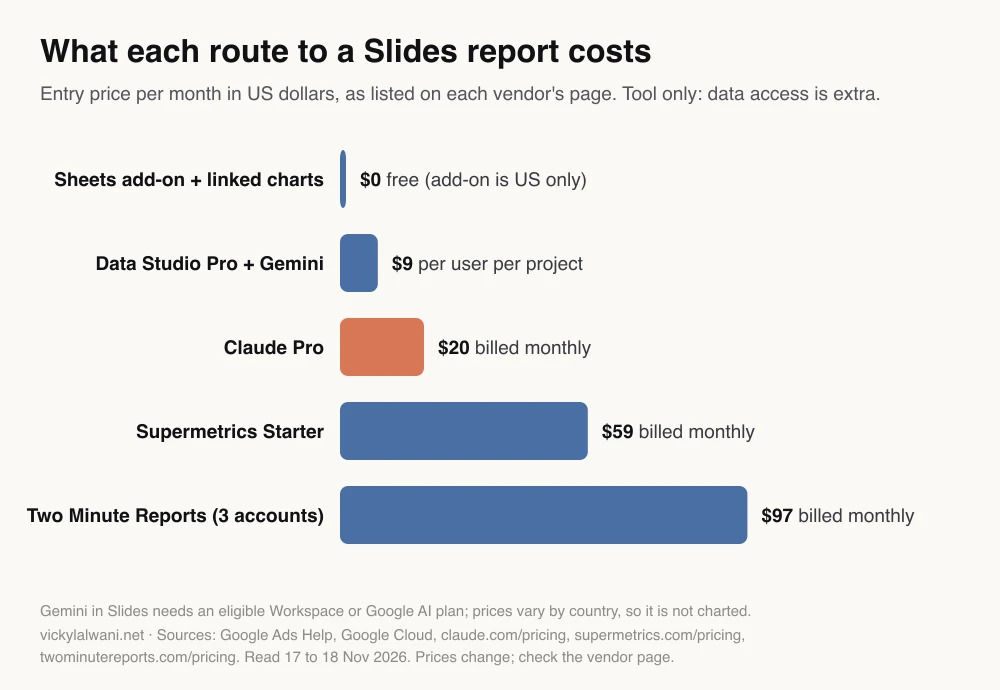
If you already build reports in Data Studio (the tool Google called Looker Studio until April 2026), Gemini can turn a report into a Slides deck. Google's documentation says it inserts each chart as an image with a written summary, needs a Data Studio Pro subscription and is a preview feature that may later cost extra. Data Studio Pro is listed at $9 per user per project per month.
Reporting tools that fill a Slides template
Reporting tools take a different approach: you design the slide, tag each text box or chart, and the tool fills it with fresh data each month. Two Minute Reports lists monthly reports "as documents or Slides" in its single plan, from $97 a month billed monthly for three accounts per connector ($81 a month billed yearly). These tools cost more, but they write real numbers into fixed places, which is easier to audit than a free-form AI draft.
| Route | Price (Nov 2026) | Charts update? | Source |
|---|---|---|---|
| Claude add-on | Paid plan; Pro $20/mo | No, images | Claude pricing |
| Gemini in Slides | Eligible plan; varies | Not documented | Workspace Updates |
| Data Studio Pro + Gemini | $9/user/project/mo | Refresh from report | Google Cloud |
| Two Minute Reports | From $97/mo (3 accounts) | Yes, on schedule | Pricing page |
| Sheets + linked charts | Free | Yes, click Update | Docs Editors Help |
How do you get Google Ads and Meta data into the deck?
Short answer: Put the numbers in a Google Sheet first. Google Ads can download any report to Google Sheets and schedule it; Meta Ads Reporting exports to .xlsx or .csv. Or connect a data connector that feeds Claude or Sheets directly. Then build every chart from that one sheet.
A single sheet of record is the step that makes the rest reliable. When every chart reads from one tab, you can check one set of numbers instead of twelve slides.
| Source | How to get it out | Note |
|---|---|---|
| Google Ads | Download to Google Sheets | Can schedule by email |
| Google Ads (US) | Google Sheets add-on | Refreshes on a schedule |
| Meta Ads | Export .xlsx or .csv | Or share a report link |
| Connector to Sheets | Supermetrics, Porter | Paid, per source or account |
| Connector to Claude | Same vendors' Claude options | Read-only access first |
The Google Ads add-on for Google Sheets is free and refreshes reports on a schedule, but Google says it is only available in the United States and in the English version of Sheets, and each spreadsheet links to one Google Ads account. Everywhere else, downloading a report as Google Sheets from the statistics table works.
On the Meta side, Ads Reporting exports saved reports as .xlsx or .csv files, or shares them as a link. Several connector vendors now also offer Claude as a destination: Supermetrics lists "Claude, ChatGPT & Copilot" among its core destinations and Porter Metrics sells an MCP integration for Claude and ChatGPT. MCP (Model Context Protocol) is the standard way Claude connects to outside tools. More on that set-up is in how to connect Google Analytics, Ads and a CRM to Claude.
Linked charts are the reason to keep a sheet
In Slides you can add a chart with Insert, Chart, From Sheets, and leave "Link to spreadsheet" ticked. When the sheet changes, click Update on the chart, or Tools, Linked objects, Update all, according to Google's help page on linked charts. That is useful when late conversions change last month's figures after the deck is built.
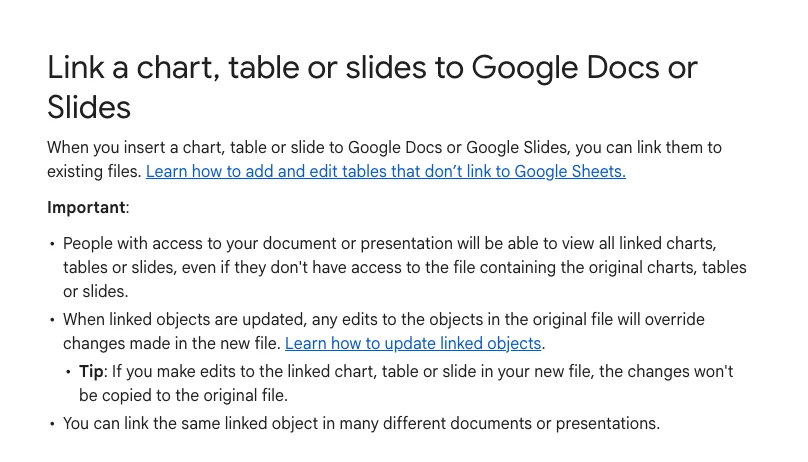
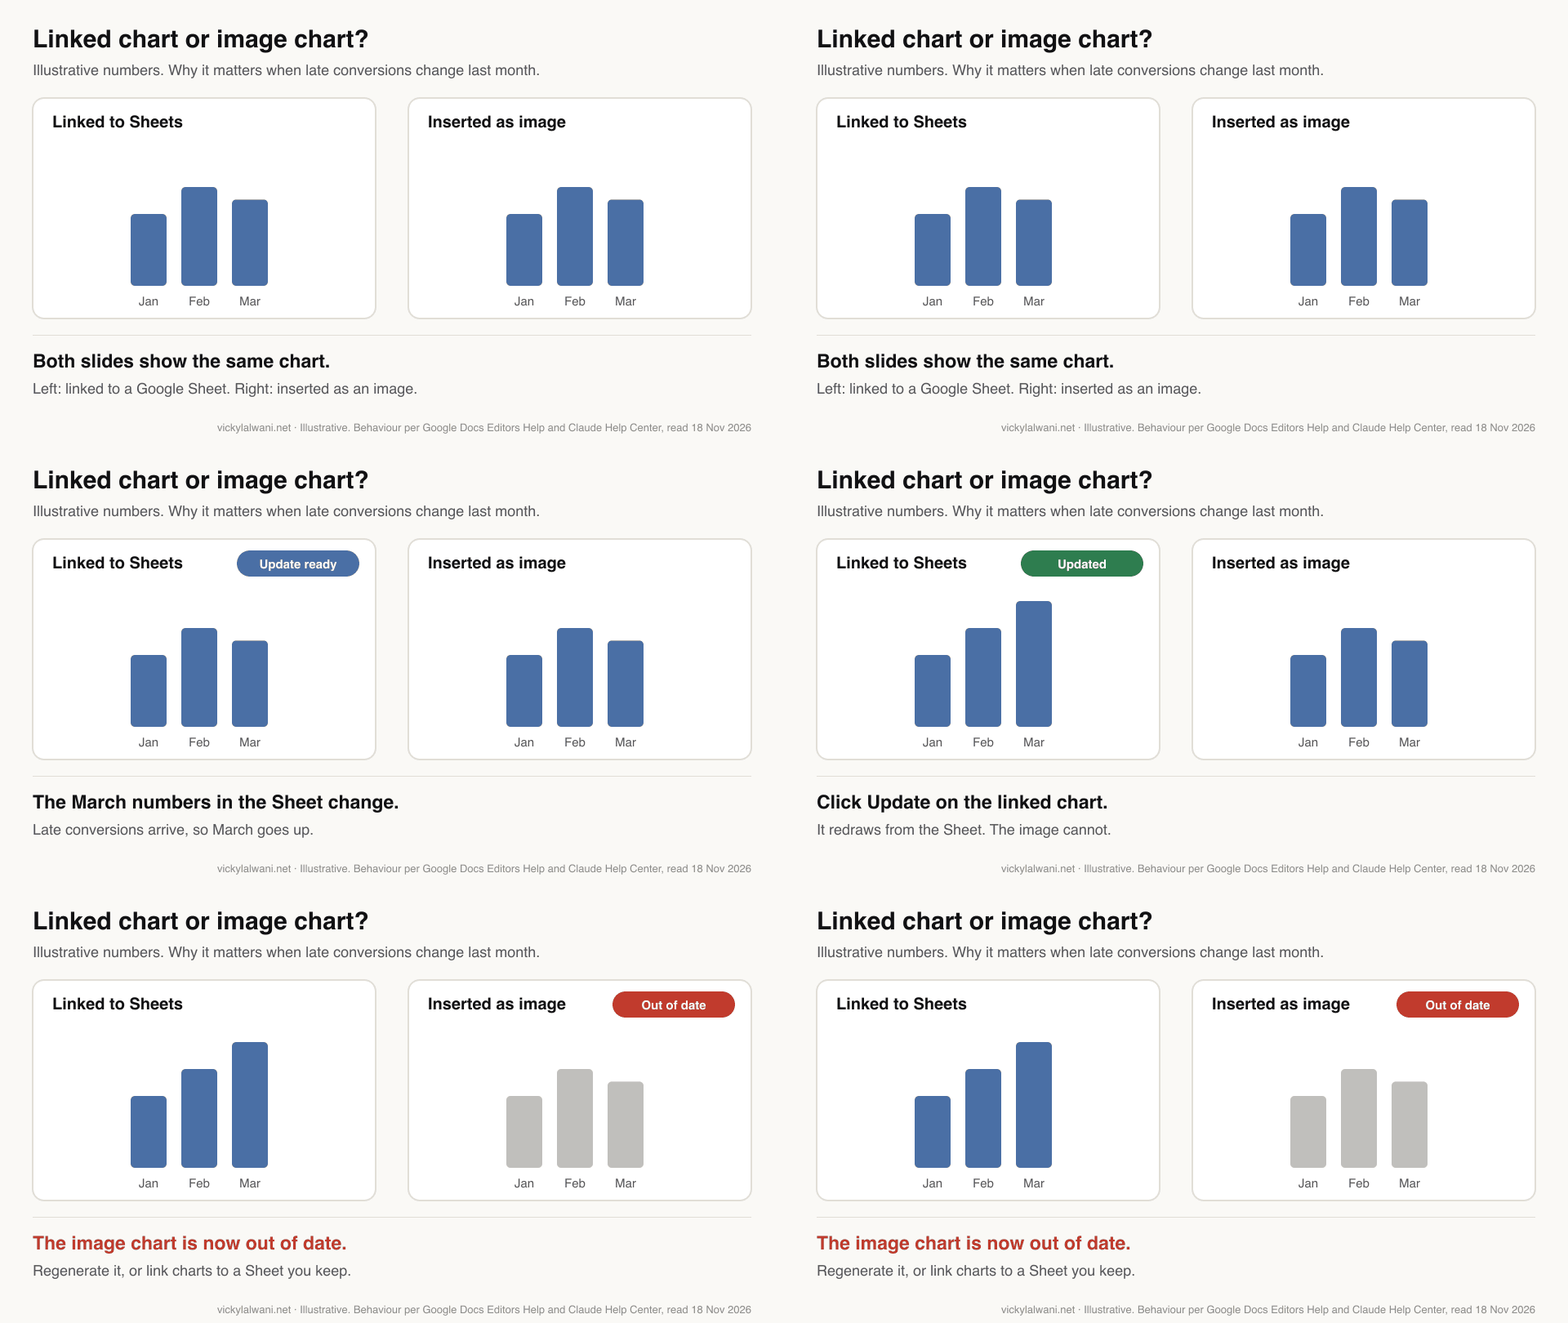
A practical split: let Claude or Gemini write and lay out the slides, and keep the charts linked to your sheet. You get the speed of the AI draft and charts you can refresh.
What prompt builds the deck?
Short answer: Give the AI the sheet, the slide order, the metric definitions and the comparison period, and tell it to use only numbers from the sheet. Then run a second prompt that checks the deck against the sheet before you read it yourself.
This prompt works in the Claude sidebar in an open deck, or in Gemini with the sheet added as a source. Replace the parts in brackets.
Build the monthly PPC report for [client] for [month year] in this deck, using its existing layouts and theme.
Use only numbers from the sheet [sheet name], tab [tab name]. Do not estimate or round differently from the sheet.

Slides, in this order:
1. Summary: three lines (what happened, why, what we do next).
2. Results vs target: spend, conversions, CPA, ROAS. Compare with [previous month / same month last year].
3. Google Ads and Meta side by side. Label each platform's conversions with its own attribution setting.
4. Top three movers and the likely reason, marked "to confirm" if the sheet does not show the reason.
5. Tests run this month and their result.
6. Three next steps, each with an owner.
7. Definitions: date range, metric formulas, attribution settings.

Put one plain-English finding at the top of each slide. Leave a blank text box on slide 1 titled "Notes from [your name]".
Check every slide for text that overflows or overlaps and fix it.
Check this deck against the sheet [sheet name]. List every number on every slide, the cell it should come from and whether it matches.
Flag any number that is not in the sheet, any comparison that uses a different date range, and any claim about a cause that the data does not show.
Do not edit the deck. Give me the list only.
The second prompt matters because AI tools add things nobody supplied. In my test of ChatGPT, Claude, Gemini and Grok, every tool added at least one business claim that was not in the brief. In a client report, an invented cause for a dip is worse than no explanation.
How do you make the report repeat every month?
Short answer: Save the slide order, metric definitions, comparison rule, tone and check list as a reusable skill or a template deck. Next month, point it at the new sheet and run the same instruction. The structure stays fixed and only the numbers change.
| Save once | Example | Why |
|---|---|---|
| Slide order | The seven slides above | Clients learn where to look |
| Metric definitions | CPA = spend / conversions | Numbers never drift |
| Comparison rule | Vs last month and last year | No cherry-picking |
| Tone | Plain, one finding per slide | Readable by non-specialists |
| Check list | The checks in the next section | Nothing ships unchecked |
In Claude, a skill is a saved set of instructions it loads when the task comes up. Anthropic's launch article describes the same pattern for a client review deck: build it once from connected account data, then save a skill so later decks keep the format. How to save one is in record a skill in Claude. In Gemini or a reporting tool, a template deck with fixed placeholders does the same job.
What should you check before the deck goes to a client?
Short answer: Match the headline numbers to each platform, confirm the date range and time zone, label each platform's attribution setting, reconcile conversions against the CRM or store, and read every next step as if you had to defend it on the call.
| Check | Where | Why |
|---|---|---|
| Spend and conversions | Each ad platform | The AI may misread a column |
| Date range and time zone | Sheet vs platforms | Off-by-one-day errors |
| Attribution setting | Google Ads, Meta | Platforms count differently |
| Leads or orders | CRM or store | Platforms over-count |
| Causes and next steps | Your own notes | No invented reasons |
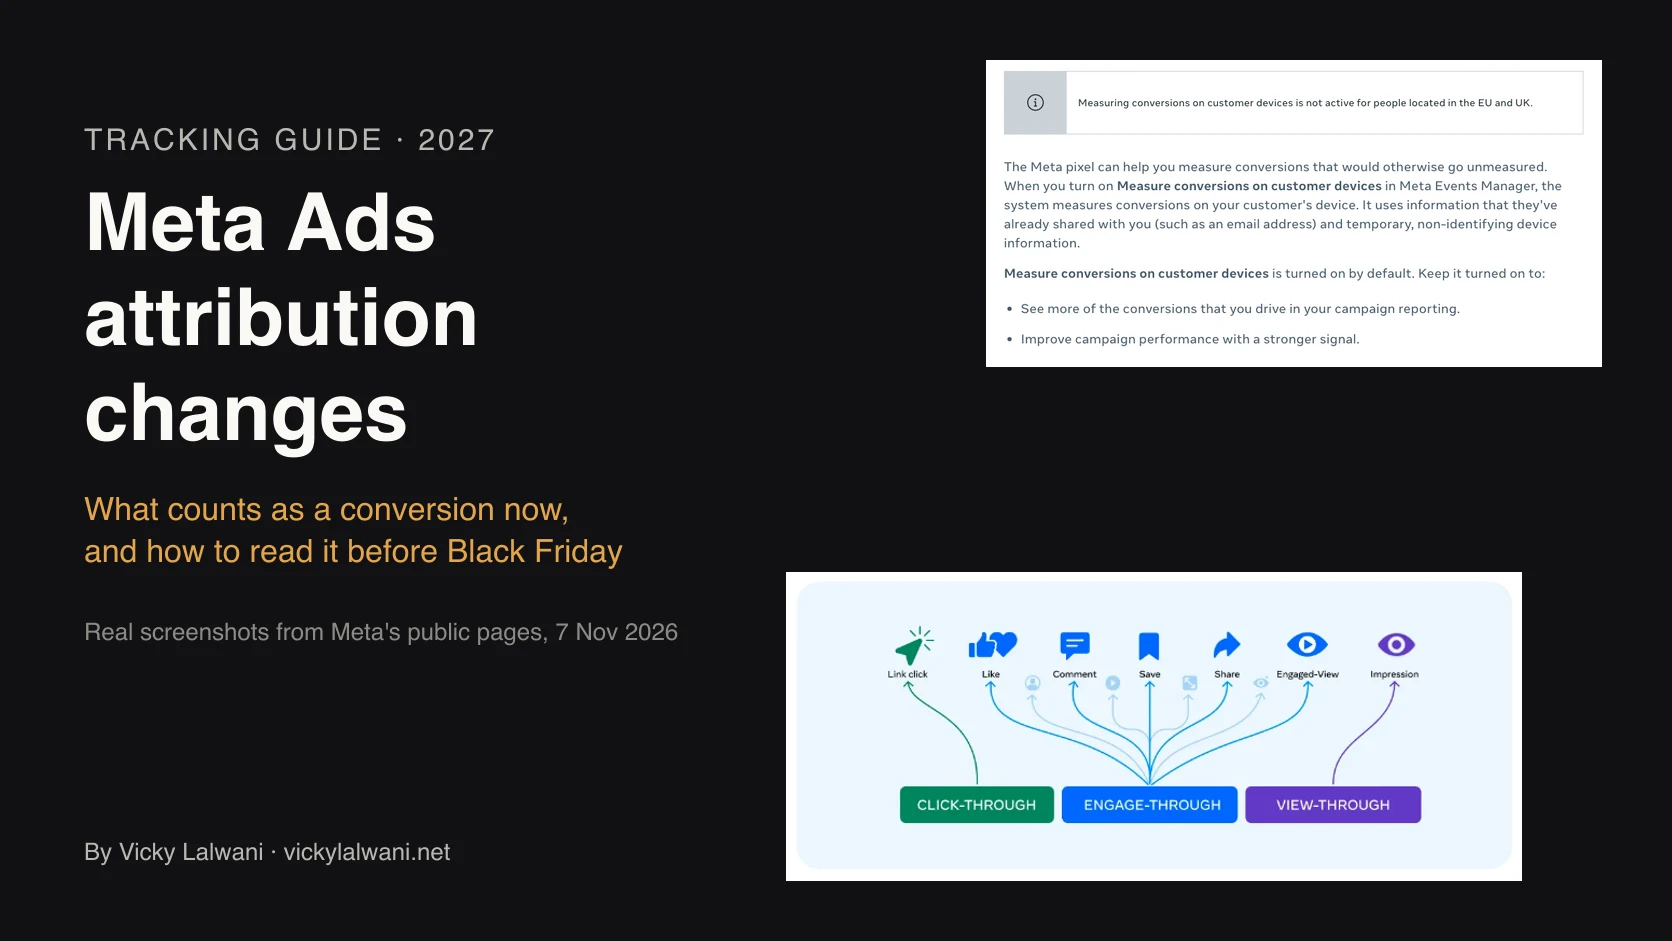
Do not add Google Ads and Meta conversions together without a note. Google Ads uses data-driven attribution for most conversion actions and no longer supports first click, linear, time decay or position-based models, according to Google's attribution page. Meta credits website conversions by click-through (1 or 7 days after a link click), view-through and engage-through windows set per ad set, according to Meta's attribution settings page. The same sale can be claimed by both. The details are in what the Meta attribution changes mean for your reports.
Before I build any report, I agree with the client which number matters most and where it is counted, usually the CRM, then check that tracked conversions roughly match it. When they do not, the problem is tracking, not reporting, and no deck fixes it. That is the work in analytics and tracking setup, and the checks are listed in the conversion tracking audit checklist.
Should the monthly report be a deck or a dashboard?
Short answer: Use a deck for the monthly conversation and a dashboard for day-to-day checks. A deck forces a story and next steps. A live client dashboard is useful for the team, but short-term swings in it tend to start daily questions.
I keep live dashboards internal until the tracking is solid, and send clients the monthly deck plus a short note. If you are choosing a dashboard tool rather than a deck, see Looker Studio alternatives for PPC reporting, which compares Data Studio, agency reporting tools and AI with connectors. For the blocks a cross-channel view needs, see one cross-channel report for Google Ads and Meta.
| Need | Deck | Dashboard |
|---|---|---|
| Monthly client call | Best fit | Too much detail |
| Daily pacing checks | Too slow | Best fit |
| Explaining a drop | Room for context | Numbers only |
| Exploring by campaign | Fixed views | Filters and drill-down |
Videos worth watching
Short answer: Start with Google Workspace's two-minute demo of Gemini building a deck, then a walkthrough of the Claude add-on. A vendor video shows how template-filling tools tag Slides elements.
How to create Slide presentations with Gemini, from the official Google Workspace channel, 22 July 2026. A short product demo: a marketer adds Drive files as sources, asks Gemini to match an older deck's style, approves an outline and gets a formatted multi-slide deck, then edits a chart with one prompt. It is Google's own promotion, so it shows the happy path only.
Claude FINALLY Works Inside Google Slides, Sheet + Docs (Full Project Management Guide), from a productivity tutorial channel, 11 October 2026. A walkthrough of Claude for Google Workspace five days after the beta launched, building branded decks from Sheets and Docs. The channel sells templates and a paid community, so treat it as a demo, not a review. Summary from the video description.
| Video | From | What it covers |
|---|---|---|
| How to create Slide presentations with Gemini | Google Workspace, Jul 2026, 2 min | Gemini building a deck from Drive files |
| Claude FINALLY Works Inside Google Slides, Sheet + Docs (Full Project Management Guide) | Productivity tutorial channel, Oct 2026, 13 min | Claude add-on in Slides, Sheets and Docs |
| How to Add Claude to Google Workspace (Step-by-Step) | IT support channel, Oct 2026, 6 min | Installing the Claude add-on |
| Automated PPC Reporting in Google Slides (Google Ads & Meta Ads) | Reporting tool vendor, Dec 2025, 27 min | Tagging Slides elements so a tool fills them |
| Monthly Client Report: What to Put in It (With an Example) | Document tool vendor, Oct 2026, 1 min | What a monthly client report should show |
Every video was checked on 17 November 2026. Three come from companies that sell the tool shown, so weigh them with that in mind.
What people say on X and Reddit
Short answer: Vendors on X sell one-prompt decks; users report mixed results with Gemini in Slides. On Reddit, practitioners care less about the tool than about a fixed template, a short written summary and numbers that match the platforms.
| Where | Date | Type | What it says |
|---|---|---|---|
| Claude (Anthropic), X | 6 Oct 2026 | Vendor | Claude edits Docs, Sheets and Slides in place; you approve each edit |
| VentureBeat, X | 7 Oct 2026 | News | Claude opens inside Google files, and Google files open inside Claude |
| Google Workspace, X | 22 Jul 2026 | Vendor | Gemini in Slides builds decks using your Docs, Sheets and PDFs as context |
| Google Workspace, X | 22 Apr 2026 | Vendor | Gemini will stick to company templates and visual styles |
| A startup operator, X | 7 Jul 2026 | First-hand | Gemini in Slides prompts often failed for them |
| A tech company founder, X | 26 Dec 2025 | First-hand | The beautify button improved a slide's layout |
| r/PPC | 11 Jul 2026 | First-hand | One template; update only what changed, plus one line on why |
| r/PPC | 23 Mar 2026 | First-hand | Tools brought connector fixes and dashboard seats nobody uses |
| r/PPC | 20 Oct 2026 | Question | Juggling several ad dashboards; one reply uses an MCP connection |
| r/PPC | 17 May 2026 | Opinion and vendor | An agency reporting poll; several replies pitch their own tools |
The Reddit threads agree on one point: clients read the summary, not the charts. The r/PPC poster who cut reporting time did it with one template and a one-line note on what moved, not a new tool. In the March thread, the most upvoted replies say reporting is about trust: one suggests the analyst owns the numbers and the account manager owns the story. On X, Google and Anthropic show the best case, while two first-hand posts disagree on how reliable Gemini in Slides is. Treat vendor posts as announcements, not proof. Reddit threads were read through the Arctic Shift archive and are credited by community only.
Where this advice is weak
- Claude for Google Workspace, the Slides connector and Gemini in Data Studio are all beta or preview. Features and limits may change within weeks.
- Gemini's usage limits and plan prices vary by country and plan. I did not chart them because I could not read one price list that applies everywhere.
- Prices come from vendor pages on 17 and 18 November 2026, in US dollars. Some vendors show annual and monthly prices differently; check the toggle.
- The seven-slide structure is my recommendation, not a standard. Small accounts may need three slides.
- I have not tested every reporting tool named here. They are listed for their published features and prices, not as recommendations.
Want someone to set up your reporting loop?
If your monthly report takes days and still starts arguments about which number is right, the fix is usually tracking first and reporting second. I can check both on a free 30-minute call. See Google Ads and PPC management, analytics and tracking setup or pricing.
Keep reading: Looker Studio alternatives for PPC, one cross-channel report for Google Ads and Meta and Meta Ads attribution changes.
Sources
| Source | What it supports | Link |
|---|---|---|
| Claude Help Center | Add-on plans, Slides abilities and limits | Use Claude in Docs, Sheets, Slides |
| Anthropic | Launch date, approval cards, skills | Claude now works with Google Docs |
| Claude Help Center | Workspace connectors | Use Google Workspace connectors |
| Anthropic | Claude plan prices | claude.com/pricing |
| Google Workspace Updates | Gemini deck generation, plans, dates | 30 June 2026 post |
| Google Docs Editors Help | Gemini in Slides steps and availability | Generate presentations |
| Google Docs Editors Help | Linked charts and Update all | Link a chart |
| Google Ads Help | Sheets add-on, US only | Add-on for Google Sheets |
| Google Ads Help | Download to Google Sheets, schedule | Create and schedule reports |
| Google Ads Help | Data-driven attribution default | About attribution models |
| Google Cloud docs | Data Studio to Slides with Gemini | Add Data Studio content to Slides |
| Google Cloud | Data Studio Pro price | Data Studio |
| Google Cloud blog | Looker Studio renamed Data Studio | Looker Studio is Data Studio |
| Google for Developers | Slides MCP server (preview) | Configure the Slides MCP server |
| Meta Business Help | Export reports | Export and share reports |
| Meta Business Help | Attribution settings | About attribution settings |
| Supermetrics | Starter price, Claude destination | Pricing |
| Two Minute Reports | Slides reports, price | Pricing |
| Porter Metrics | MCP for Claude, price | Pricing |
| Claude (Anthropic) | Claude edits Docs, Sheets and Slides in place; you approve each edit | Post or thread |
| VentureBeat | Claude opens inside Google files, and Google files open inside Claude | Post or thread |
| Google Workspace | Gemini in Slides builds decks using your Docs, Sheets and PDFs as context | Post or thread |
| Google Workspace | Gemini will stick to company templates and visual styles | Post or thread |
| A startup operator | Gemini in Slides prompts often failed for them | Post or thread |
| A tech company founder | The beautify button improved a slide's layout | Post or thread |
| r/PPC | One template; update only what changed, plus one line on why | Post or thread |
| r/PPC | Tools brought connector fixes and dashboard seats nobody uses | Post or thread |
| r/PPC | Juggling several ad dashboards; one reply uses an MCP connection | Post or thread |
| r/PPC | An agency reporting poll; several replies pitch their own tools | Post or thread |
Pages read on 17 and 18 November 2026. Videos, X posts and Reddit threads were checked on the same days.
This article expands on my post on LinkedIn ↗.
FAQ
Can Claude build a PPC report in Google Slides?
Yes. The Claude for Google Workspace add-on, in beta on paid Claude plans since 6 October 2026, can create and restyle slides in an open deck using its layouts. Charts it creates go in as images, so they do not update when your numbers change.
Can Gemini create a Google Slides presentation from my ad data?
Gemini in Google Slides can build a full deck from a prompt and files in your Drive, such as a sheet of exported Google Ads and Meta numbers. It does not connect to the ad platforms itself, and it needs an eligible Workspace or Google AI plan.
How do I get Google Ads data into Google Slides automatically?
Download or schedule the report to Google Sheets, then insert charts into Slides from that sheet with Link to spreadsheet ticked. In the US, the free Google Ads add-on for Sheets can refresh the data on a schedule.
Do charts update automatically in Google Slides?
Charts linked to a Google Sheet update when you click Update on the chart or use Tools, Linked objects, Update all. Charts inserted as images, which is how Claude and Data Studio add them, have to be regenerated instead.
What should a monthly PPC report include?
A summary, results against target, a channel breakdown, what changed, tests run, next steps and a definitions slide. Each slide should open with one finding in plain words above the chart.
How do I show Google Ads and Meta conversions in one report?
Show them side by side with each platform's attribution setting labelled, and avoid adding them into one total without a note. Compare both against CRM leads or store orders, which count each sale once.
Is there a free way to automate a PPC report in Google Slides?
Yes, with more set-up. Download Google Ads and Meta data to a Google Sheet, build linked charts in Slides, and refresh them each month with Update all. Writing the commentary is the part AI tools speed up.
Can I trust an AI-written PPC report without checking it?
No. AI tools can misread a column or invent a reason for a change. Check the headline numbers against each platform and run a second prompt that lists every figure and its source cell before you read the deck yourself.