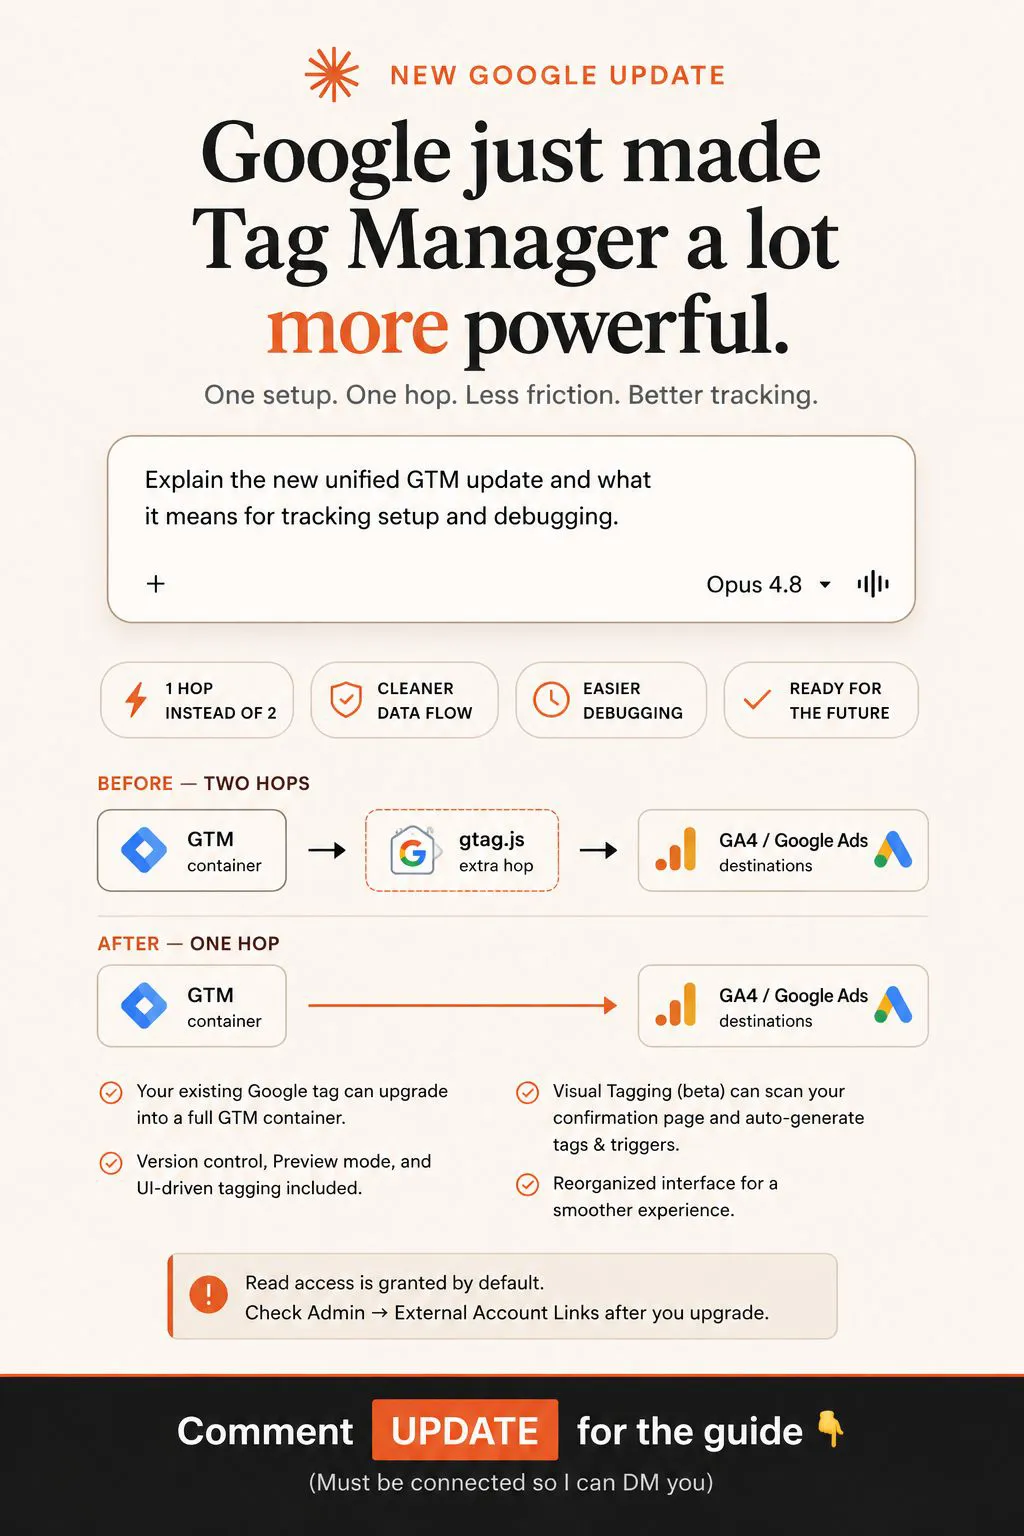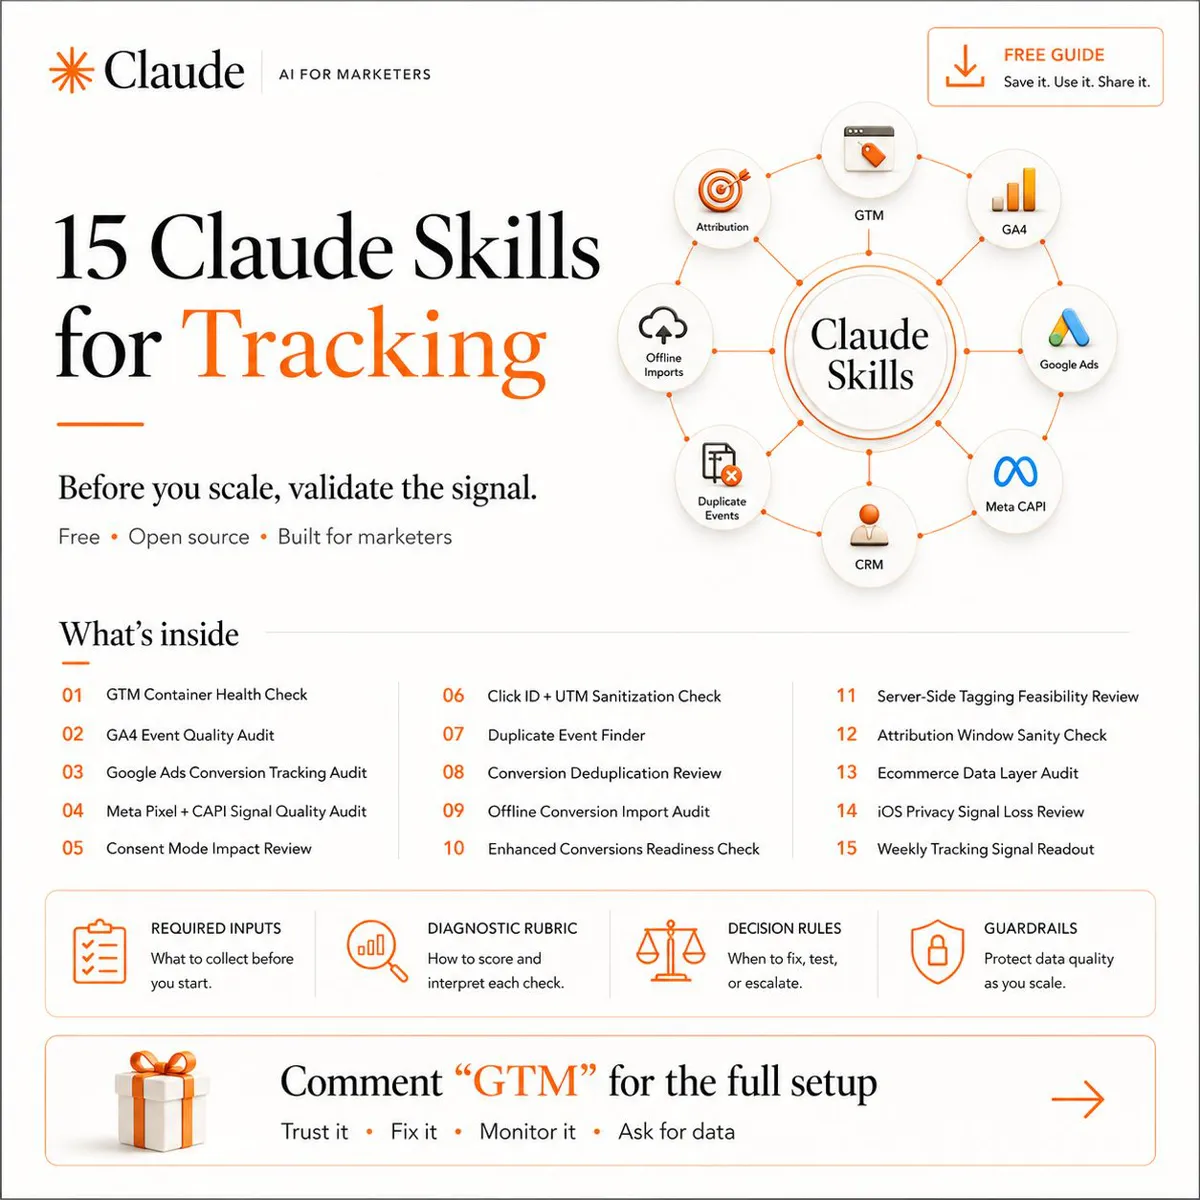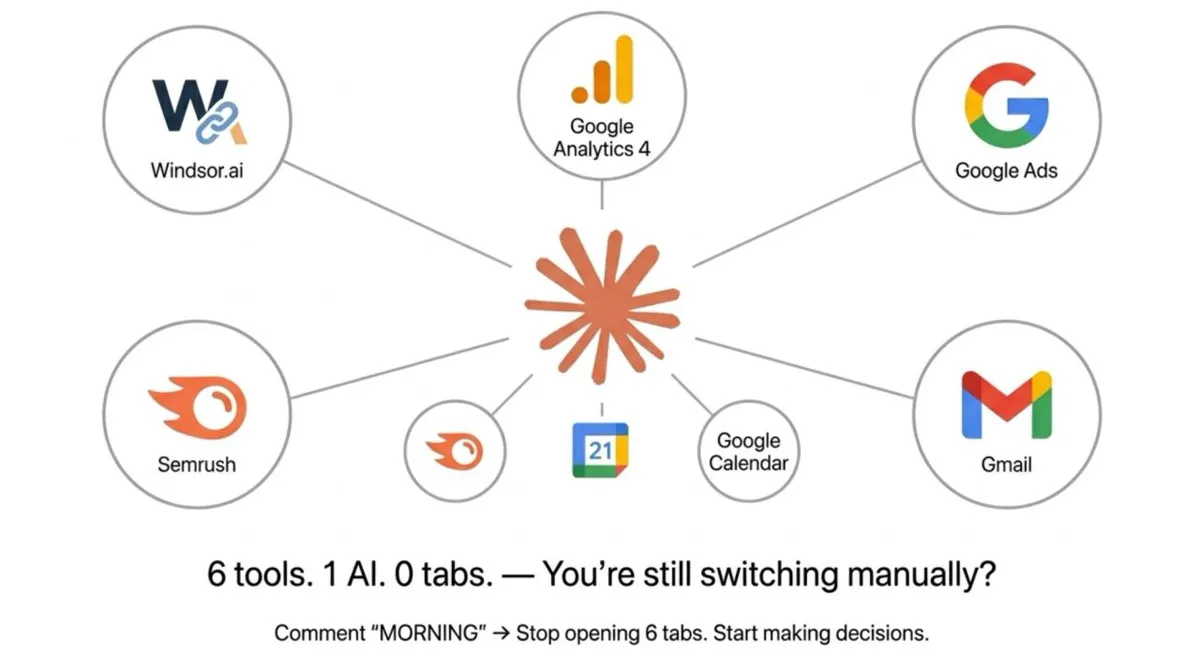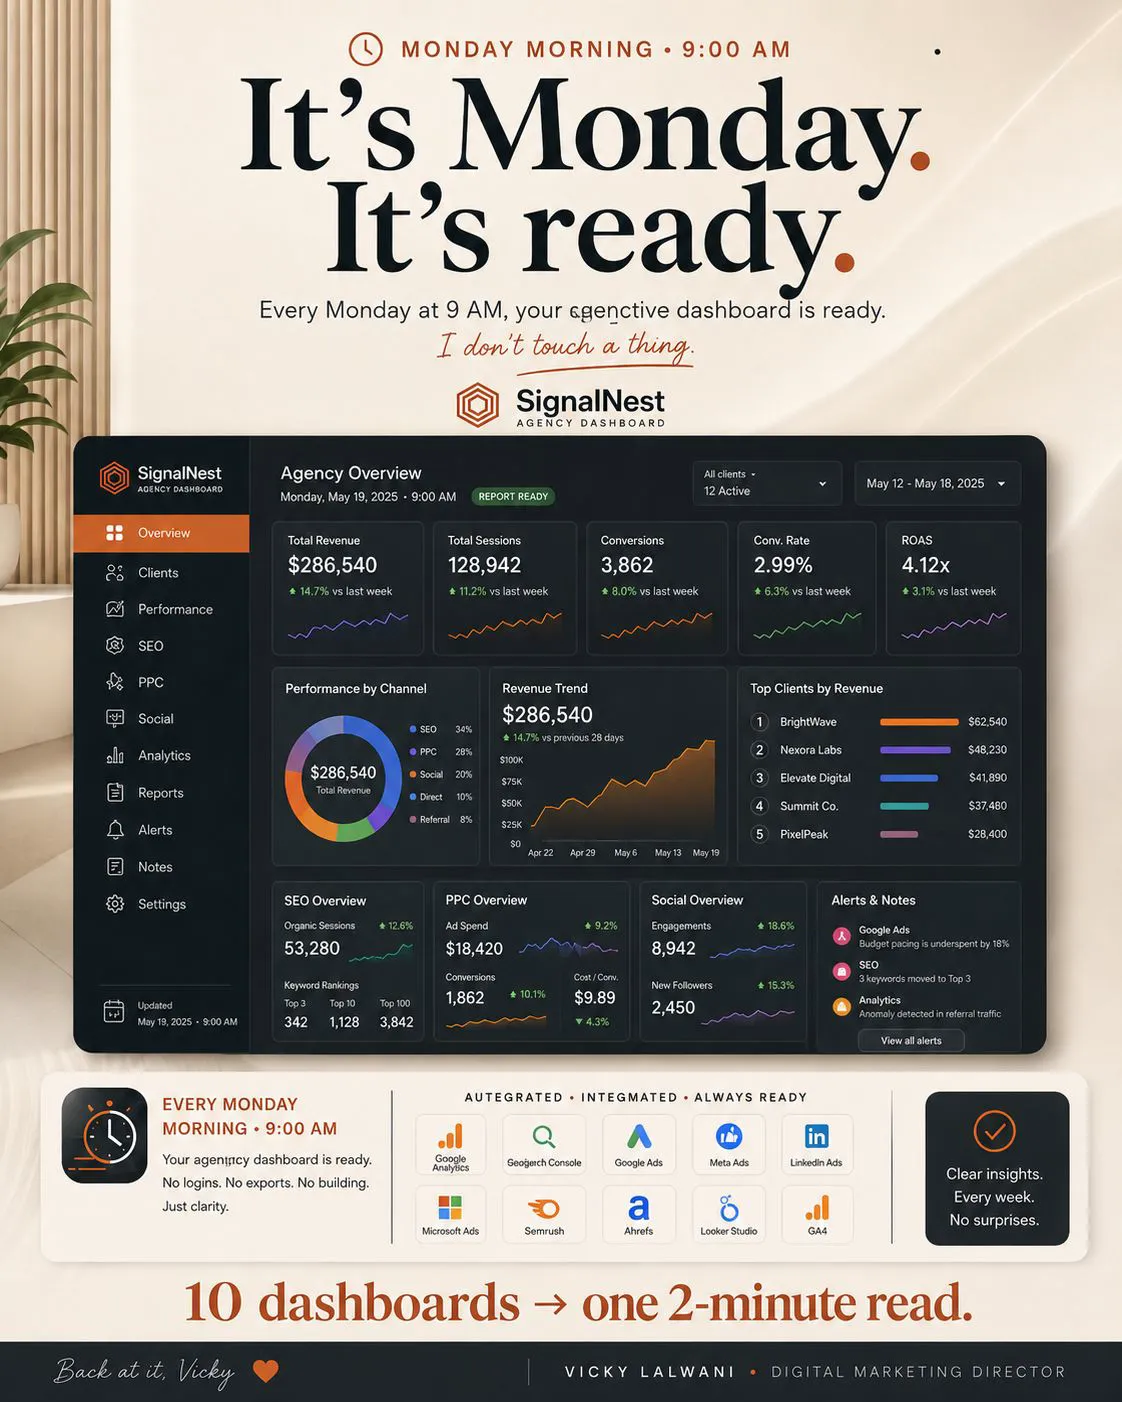
An executive marketing dashboard puts revenue, leads, paid media, search and AI search visibility on one weekly page for leaders. In November 2026 you can schedule it in Data Studio (the new name for Looker Studio), in GA4, or with a Claude scheduled task, but the numbers only hold up if definitions are agreed, the data has finished processing and a person reviews the page before it sends.
TL;DR
An executive marketing dashboard is one page, read in about two minutes: headline numbers, paid media, search, AI search and three ranked priorities. If a number would not change a decision, it does not go on the page.
In November 2026 there are three ways to send it on a schedule: Data Studio (Looker Studio was renamed on 16 April 2026), GA4 scheduled emails, or a Claude scheduled task that reads your tools and writes the summary.
Time it to the data. GA4 usually has yesterday ready in Reports by about 3:30pm in the property's time zone, and Google warns events can take up to 72 hours. A Monday 9am report should cover the week to Saturday.
Trust comes from agreed definitions, a source and date range under every block, a few weeks of reconciling against the source tools, and a person who reads the page before leadership does.
You open the leadership meeting and three people have three numbers for last week's leads. One took it from GA4, one from the CRM, one from the Google Ads screen. Nobody is wrong, exactly. The data was never the problem. The assembly and the definitions were.
An executive marketing dashboard that builds itself fixes the assembly. It cannot fix the definitions or broken tracking, so this guide covers both. If you would rather have the measurement and the report set up for you, that is what my analytics and tracking service does.
What is an executive marketing dashboard, and what goes on it?
Short answer: It is a one-page weekly view of marketing for people who decide budgets: five blocks covering headline results, paid media, search, AI search visibility and three ranked priorities, each compared with the week before. It is a summary, not a list of every metric.
The request I hear most about reports is some version of "can it show a summary, not a list?" Leaders want the state of the business in two minutes, the change since last week, and a benchmark behind every label so that "good" means something.
| Block | What goes in it | Usual source |
|---|---|---|
| 1. Headline numbers | Revenue, leads, ad spend, cost per lead, week on week | CRM or shop, GA4, ad platforms |
| 2. Paid media | Spend and cost per lead by platform, waste caught | Google Ads, Meta Ads |
| 3. Search | Organic clicks, pages that moved, fixes shipped | Search Console, GA4 |
| 4. AI search | Where the brand is named in AI answers | A fixed weekly prompt check |
| 5. Three priorities | Ranked moves for this week, each with a reason | Written, then reviewed by a person |
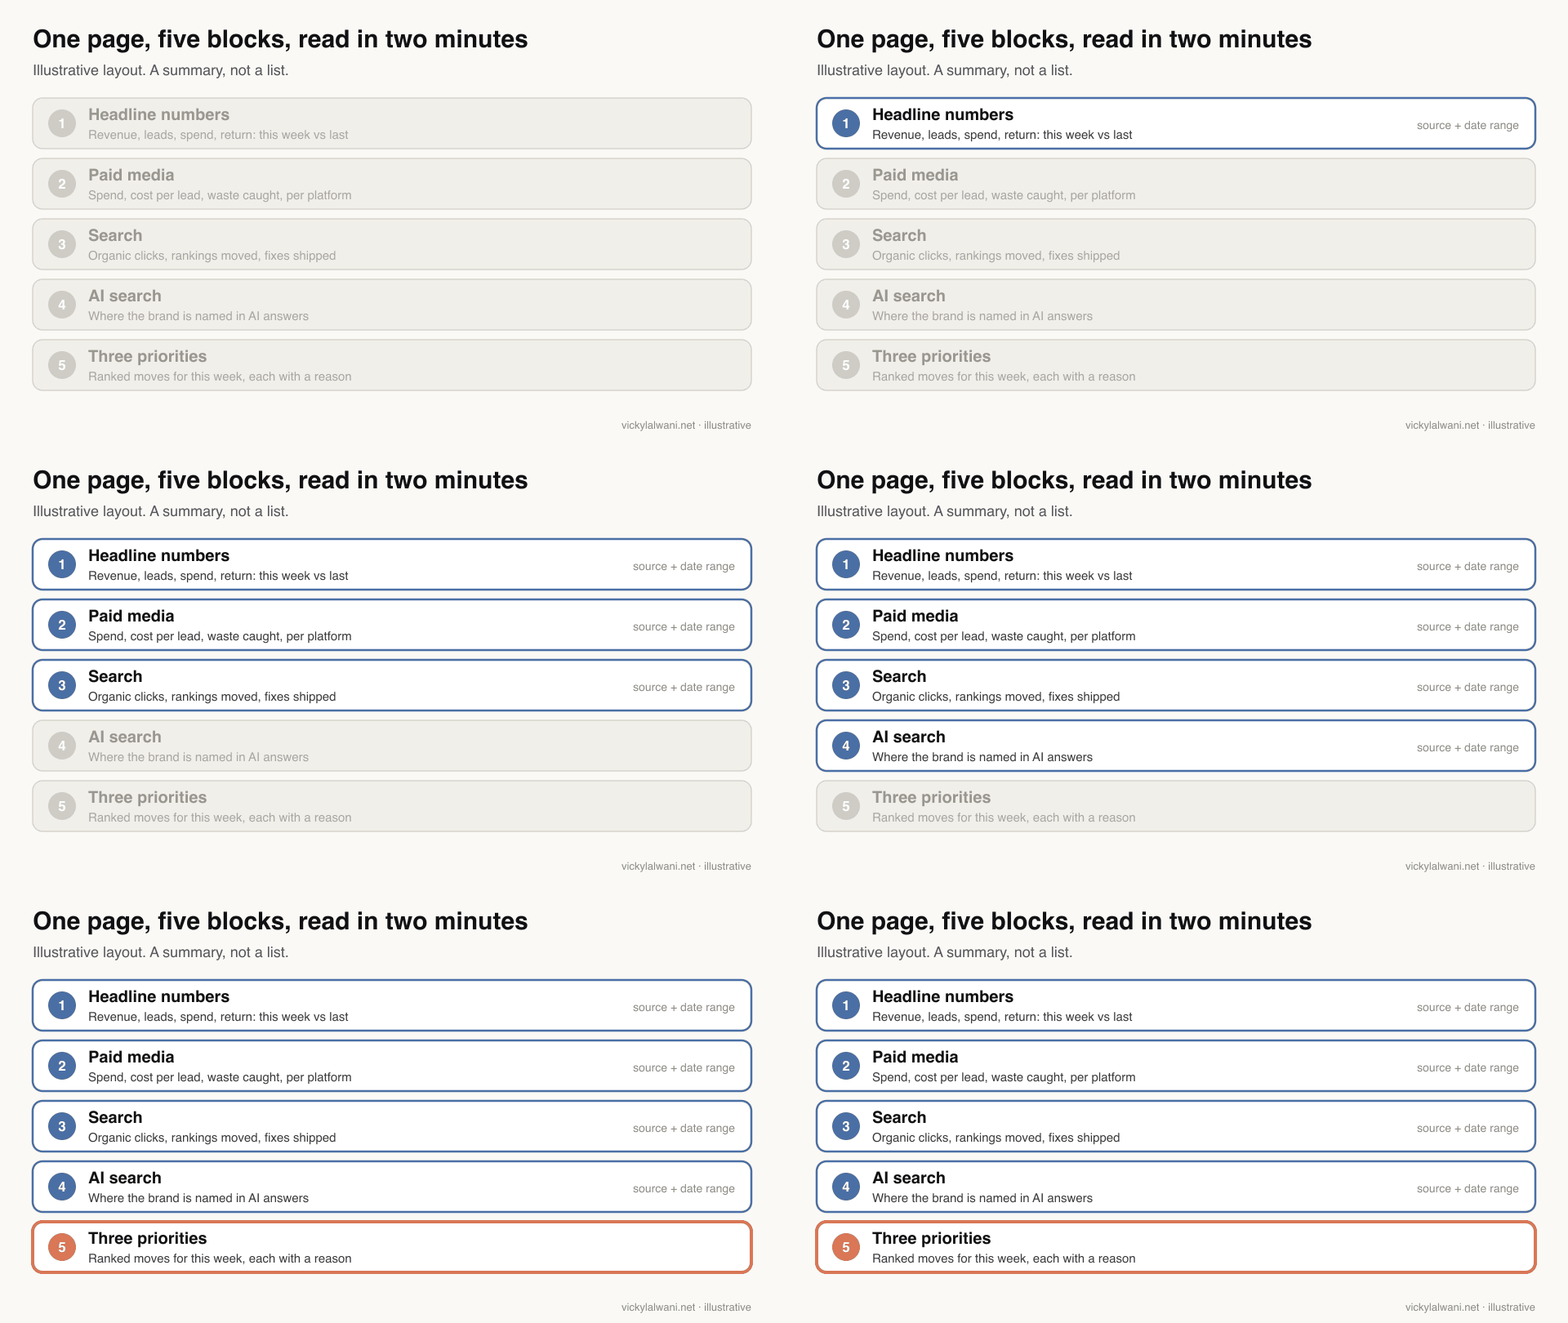
The last block is the one that changes behaviour. Numbers without a recommendation create more meetings. Keep the ad platform detail out of this page: if a leader wants it, link to the full paid media report, such as the one in my guide to a single Google Ads and Meta report.
For block 4, there is no standard metric yet. Run the same set of buyer questions through the main AI assistants each week and record whether you are named. My AI citation audit explains how to set that list up.
What changed in the reporting tools by November 2026?
Short answer: Looker Studio is called Data Studio again (16 April 2026), GA4 added an AI assistant called Ask Advisor plus AI summaries on its homepage, Google Ads added prompt-built dashboards in beta, and Claude scheduled tasks now run in the cloud even when your computer is off.
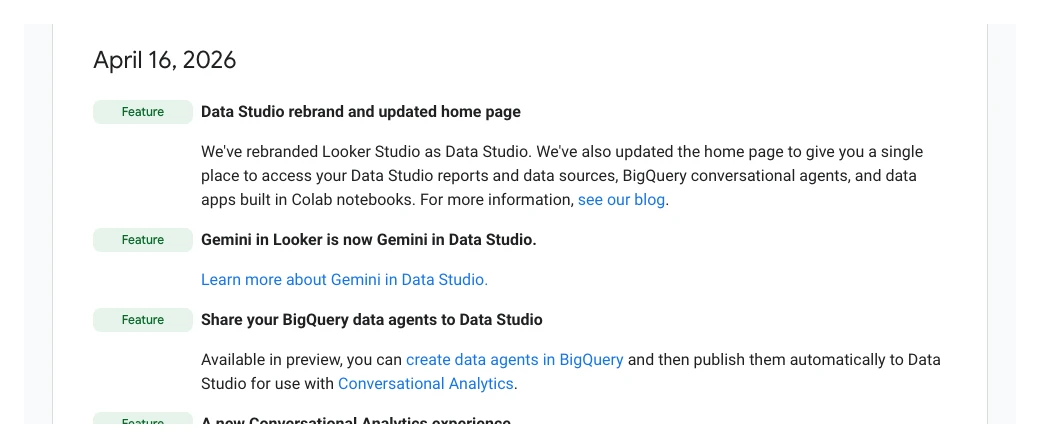
If your team still searches for "Looker Studio", that is fine: Google says existing reports carried over. The Data Studio release notes put it plainly: "We've rebranded Looker Studio as Data Studio." The paid edition is now Data Studio Pro, and the free edition remains no cost, according to Google's announcement.
| Tool | What changed | When |
|---|---|---|
| Data Studio | New name for Looker Studio; Pro edition renamed too | 16 Apr 2026 |
| Data Studio | Conversational Analytics generally available | 30 Jul 2026 |
| Data Studio Pro | Hourly schedules and alerts | 5 Dec 2025 |
| GA4 | Ask Advisor (beta, English-language properties) | Google Marketing Live 2026 |
| GA4 | AI summary at the top of the homepage, opt-in email updates | 10 Aug 2026 |
| Google Ads | Dashboards from text prompts (beta); GA4 "coming soon" | 10 Aug 2026 |
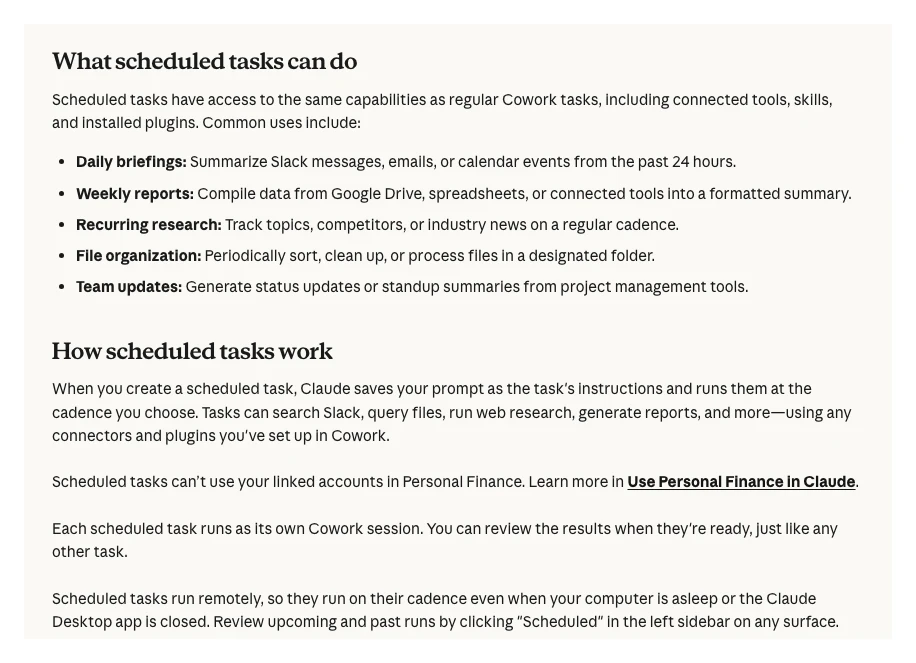
| Claude | Cowork scheduled tasks run remotely | Help page, Nov 2026 |
Two cautions. The Google Ads dashboards and the GA4 homepage summaries are, in Google's own post, "currently available in beta for English language accounts". And GA4's Ask Advisor help page says answers use only data from that one property, so it cannot see your CRM or your Meta spend. Neither replaces a cross-tool executive page.
Which tool should build and send the report?
Short answer: Use Data Studio when leaders want a live dashboard they can click, GA4 scheduled emails when a single GA4 report is enough, and a Claude scheduled task when the page needs data from several tools plus a written summary and priorities. Many teams end up using two of them.
| Need | Data Studio | GA4 email | Claude task |
|---|---|---|---|
| Live, clickable dashboard | Yes | No | No |
| Written summary and priorities | Not its job | No | Yes |
| Data from many tools | Yes, via connectors | GA4 only | Yes, via connectors |
| Fastest schedule | Daily (hourly on Pro) | Daily | Hourly |
| Recipients per schedule | Up to 50 | Up to 50 | You choose the destination |
| Format | PDF plus link | PDF or CSV | Document or message |
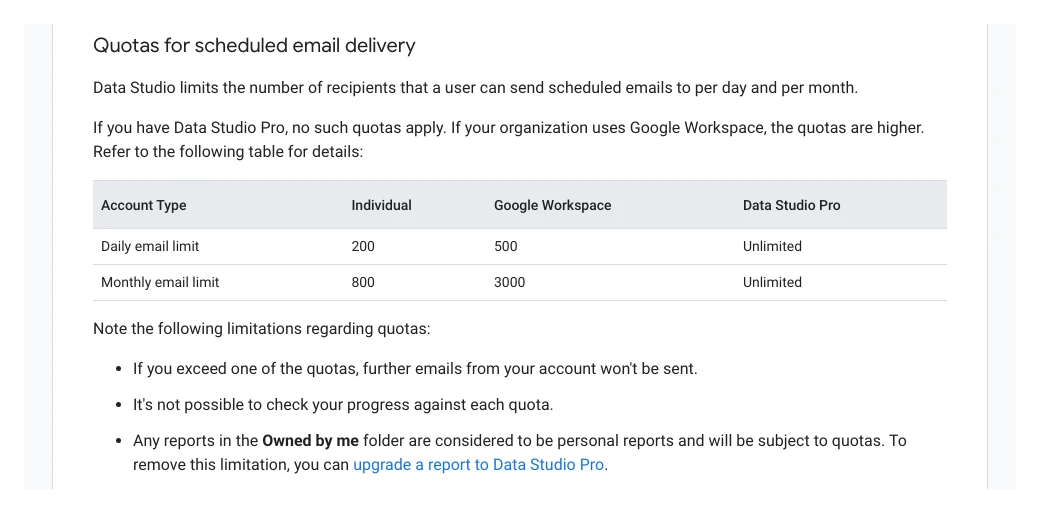
Data Studio's free edition allows one schedule per report, at most once a day, sends a PDF with a link back to the report, and caps recipients. Since March 2025 it also limits how many people you can email per day and per month.
| Email quota | Personal account | Workspace | Pro |
|---|---|---|---|
| Per day | 200 | 500 | Unlimited |
| Per month | 800 | 3,000 | Unlimited |
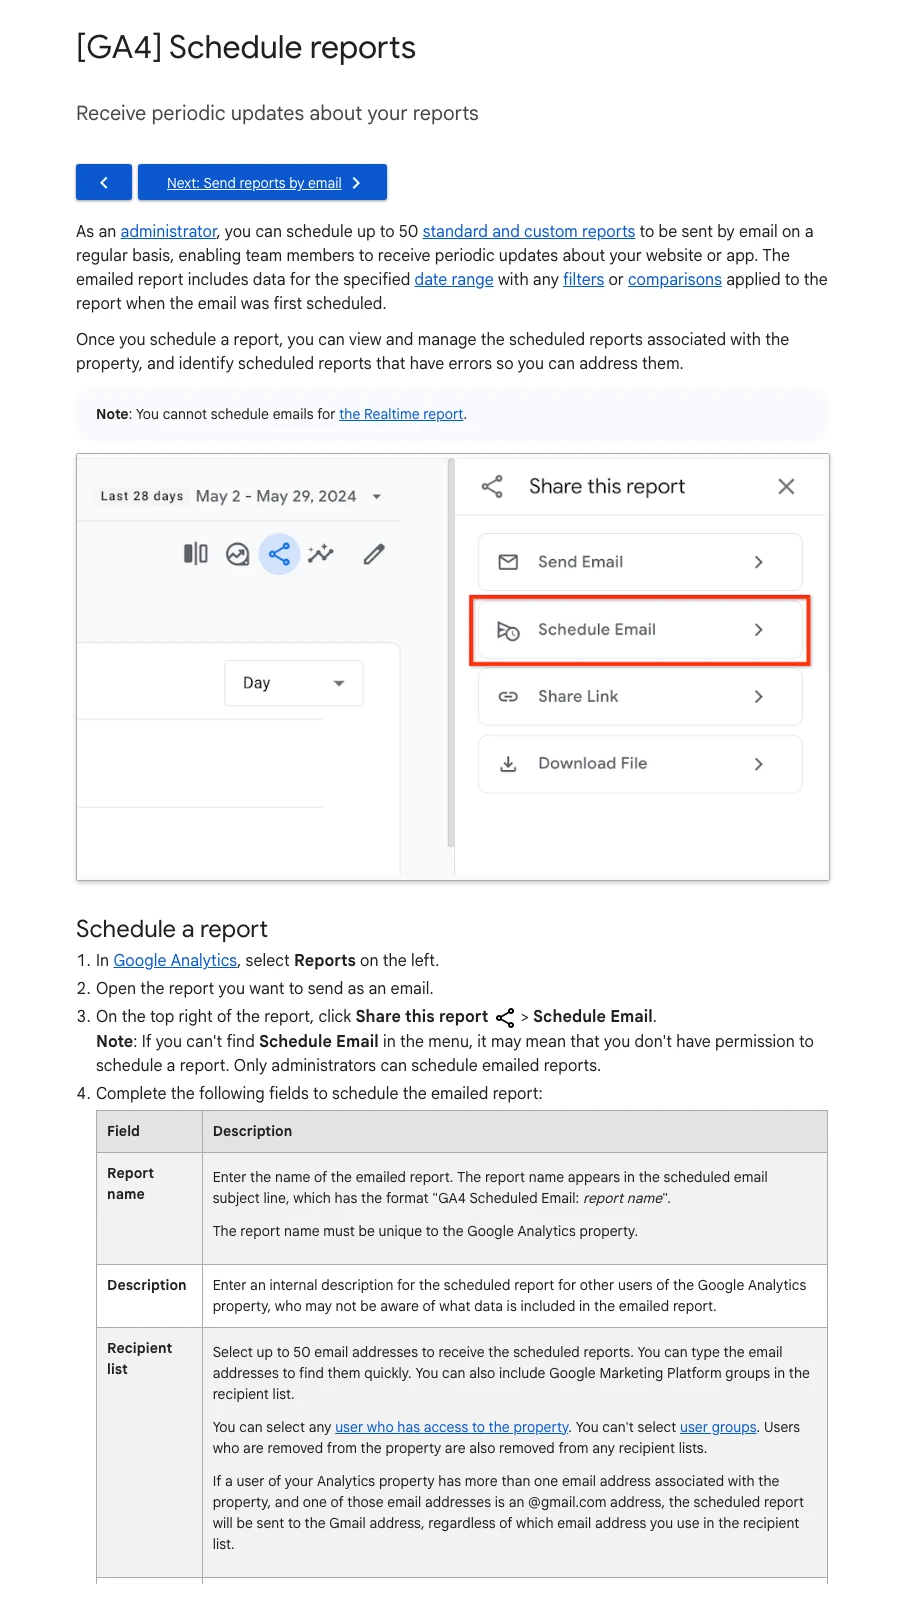
GA4 can also email a report. Only administrators can schedule one, each property can have up to 50, and each schedule stays active for 1 to 12 months, as Google's Schedule reports page sets out. That suits a fixed traffic or key event report, not a cross-tool page.
The Claude route is a Cowork scheduled task: you describe the job once, choose hourly, daily, weekly or weekdays, and it runs with your connectors, skills and plugins. Developers can do the same with Claude Code cloud scheduled tasks, which are still a research preview. My comparison of Looker Studio alternatives goes deeper on when an AI assistant can replace the dashboard build.
How does the report assemble itself each week?
Short answer: Five layers, built once: read-only connections to each data source, a written list of definitions, checks that run before any sentence is written, a prompt that drafts the page, and a schedule that delivers a draft for a person to approve before it goes to leadership.
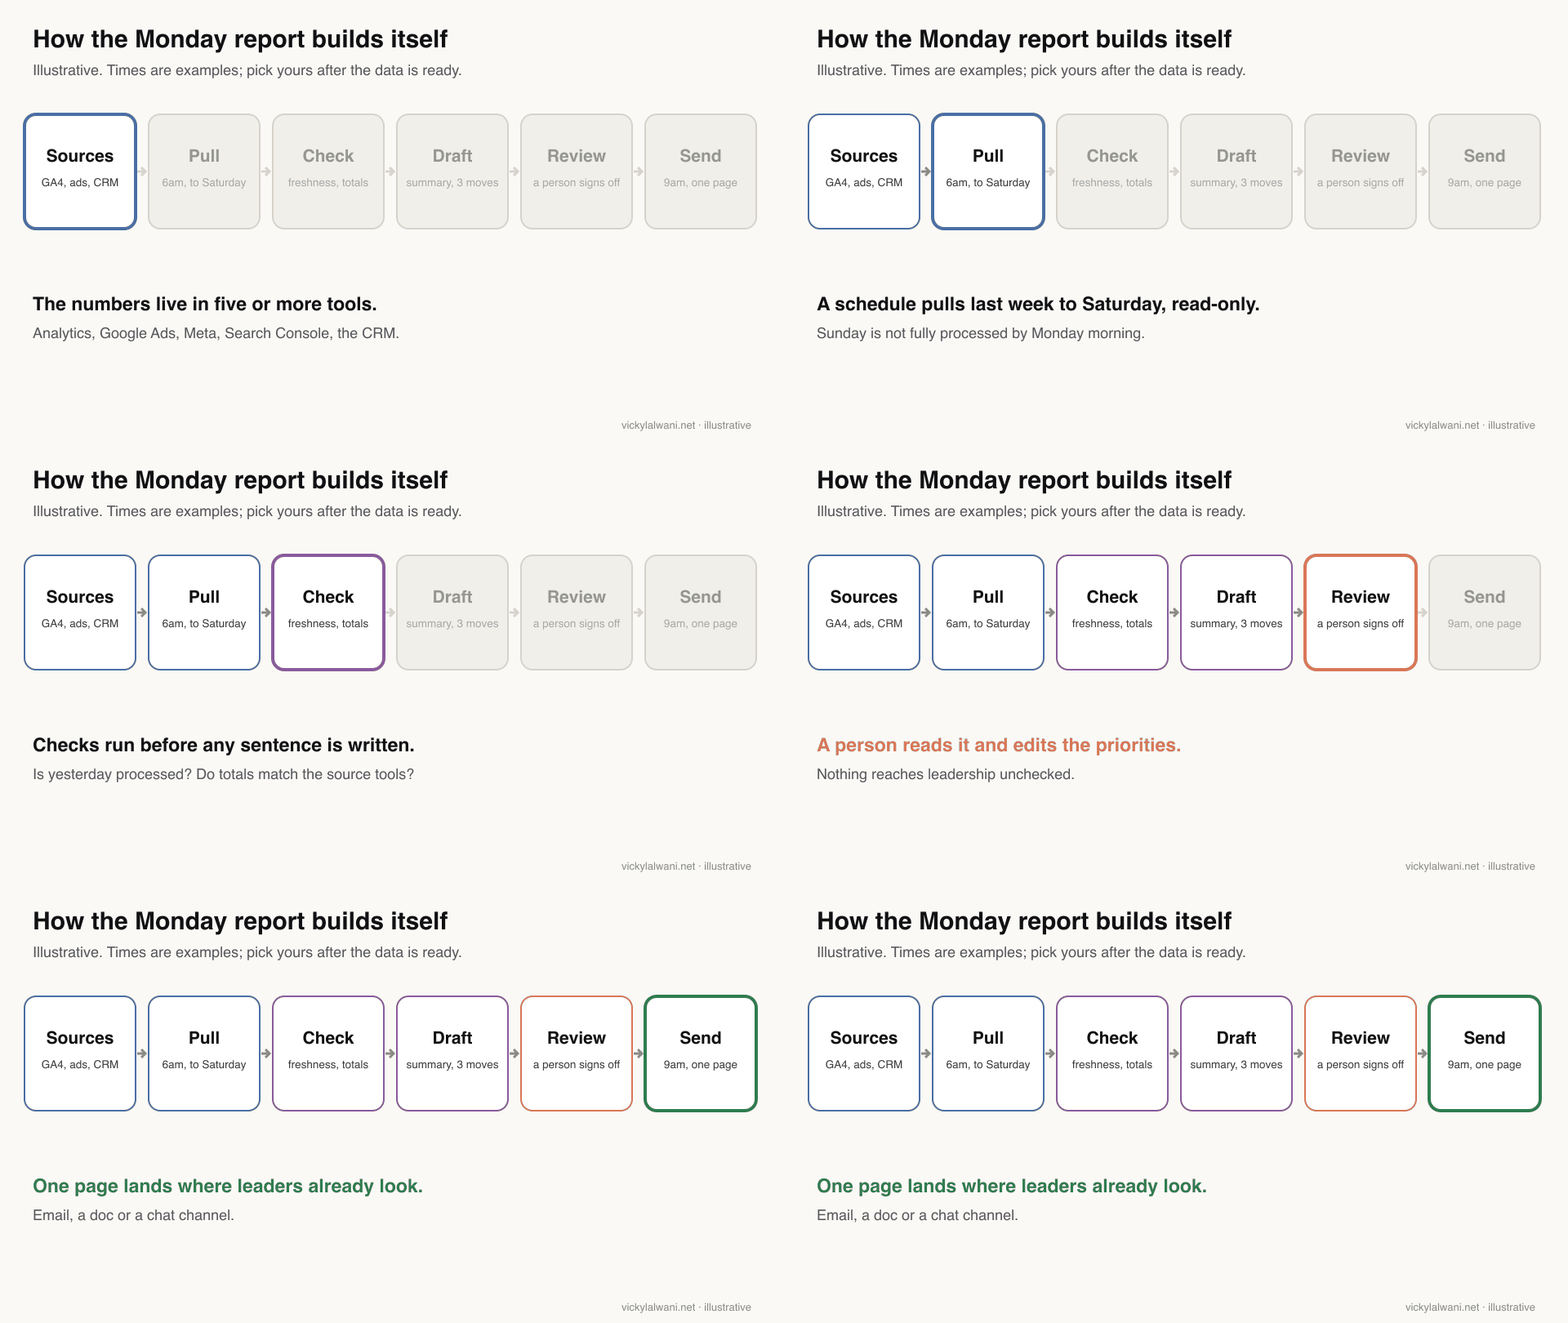
- Connections. Give the assistant read access only. For GA4, Google publishes an open-source Google Analytics MCP server; its write tools only work if you pass an extra flag. Google's Google Ads MCP server is read and partial write (assets and labels), and can be locked to read-only. Use exports where no connector exists.
- Definitions. One file that says what a lead, a conversion and revenue mean, and which tool owns each number.
- Checks. Is every day present? Do totals match the source tool? Did leads in GA4 and the CRM drift apart?
- Prompt. One prompt per page, fixed format, compared with the previous week. An example is below.
- Schedule and delivery. Draft first, approve, then send to the place leaders already read: email, a shared document or a chat channel.
This weekly prompt is a starting point for a Claude scheduled task. Replace the square brackets with your own values.
You are writing the weekly executive marketing report for [company].
Reporting week: Monday to Saturday last week, compared with the same six days the week before.
(Sunday is left out because Google Analytics usually finishes processing a day by mid afternoon the next day.)

Data you can use (read-only): Google Analytics 4, Google Ads, Meta Ads export in reports/meta/, CRM leads export in reports/crm/.
Definitions are in definitions.md. Use them exactly. If a number cannot be matched to a definition, leave it out and say so.

Before writing:
1. Check every source has data for every day in the week. If a day is missing, stop and write "Data incomplete: [source], [day]" at the top.
2. Compare leads in GA4 with leads in the CRM. If they differ by more than [x]%, flag it in one line.

Write one page with five blocks:
1. Headline numbers: revenue, leads, ad spend, cost per lead. This week, last week, change.
2. Paid media: spend and cost per lead by platform, plus anything that spent with no leads.
3. Search: organic clicks and the pages that gained or lost most.
4. AI search: the result of the weekly prompt check in ai-prompts.md.
5. Three priorities for this week, ranked, each with one reason and the number behind it.

Under each block, write the source and date range in small text.
Start with three lines: where we are, what we are doing, what is next.
Do not recommend budget changes. Do not send anything. Save the draft to reports/weekly/[date].md for review.
From the official Google Analytics channel, July 2025. A product demo of asking an assistant questions about GA4 data; it does not sell a paid product.
When is last week's data actually final?
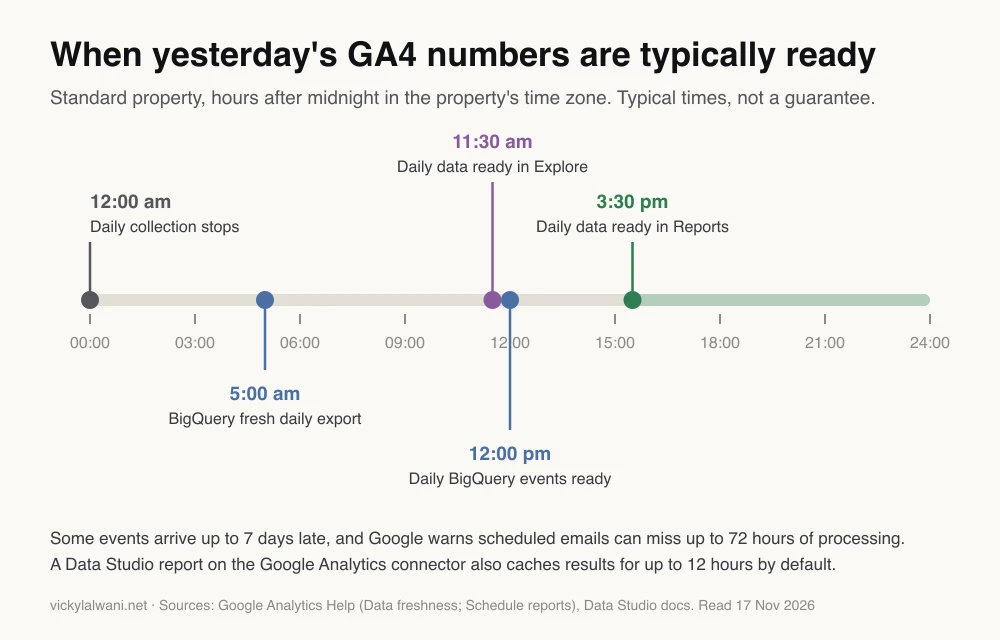
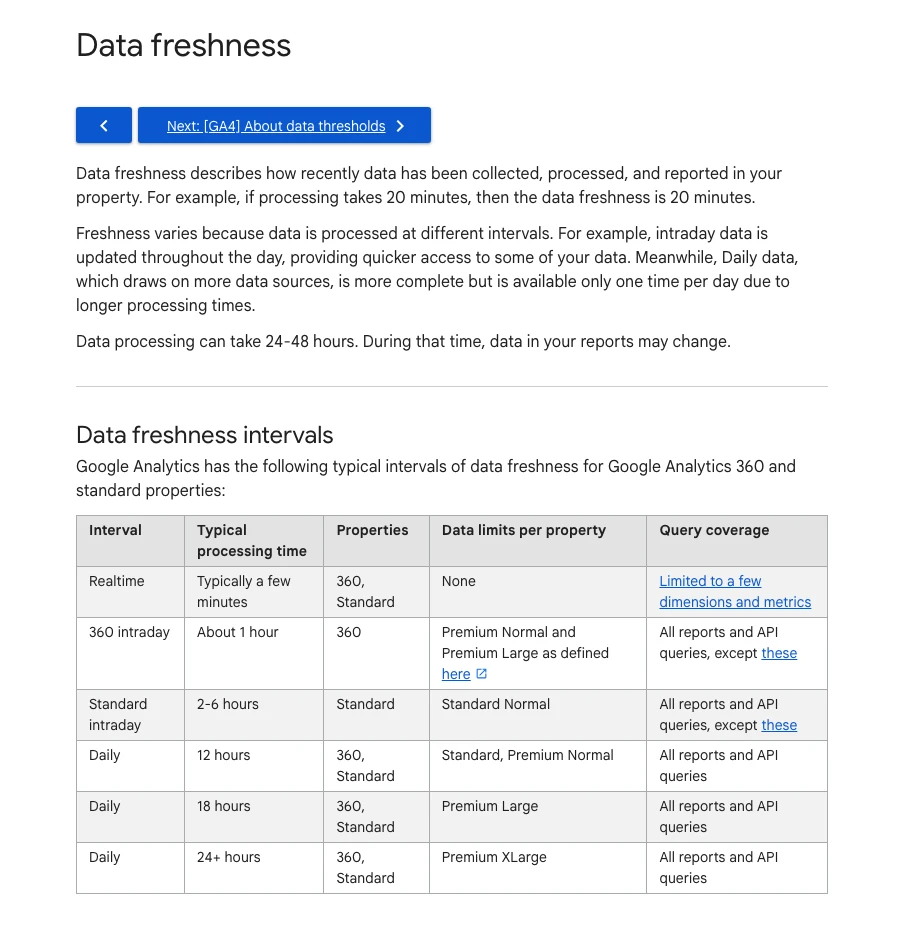
Short answer: Not on Monday morning. For a standard GA4 property, yesterday's daily data is typically ready in Reports by about 3:30pm in the property's time zone, some events arrive up to 7 days late, and attribution can shift for up to 12 days. Report the week to Saturday, or send on Tuesday.
Google's data freshness page says "Data processing can take 24-48 hours. During that time, data in your reports may change." It lists typical times for the previous day, which the chart below draws.
| Layer | Typical delay | What it means for Monday |
|---|---|---|
| GA4 realtime | A few minutes | Too thin for a weekly page |
| GA4 standard intraday | 2 to 6 hours | Channels may be missing |
| GA4 daily | About 12 hours | Use this; Sunday not ready at 9am |
| Late events | Up to 7 days | Small restatements are normal |
| Data Studio cache | Up to 12 hours | Refresh before you send |
Data Studio adds its own delay. Its Google Analytics data sources refresh every 12 hours by default, and reports on the GA4 connector are subject to Google Analytics Data API quotas: 200,000 core tokens per property per day on a standard property. A report many people open at 9am on Monday can hit them, which is one more reason to send a PDF or a written page rather than ask everyone to open a live dashboard at once.
How do you make the numbers trustworthy?
Short answer: Agree definitions in writing, decide which tool owns each number, print the source and date range under every block, run the automated page beside the manual one for a few weeks, and keep a person reviewing the priorities. Fix tracking first, or the page will tell the wrong story with confidence.
- Define every metric in writing. "Lead" must mean the same thing every week, in every block.
- Pick one owner per number. Revenue from the CRM or shop, not from an ad platform.
- Show the source and date range under each block so anyone can trace a figure.
- Run it beside the manual report for three or four weeks and explain every difference.
- Keep a human review step, especially for the priorities block.
- Fix tracking gaps first. My event map guide is where I start.
Expect tools to disagree even when nothing is broken. GA4 reports in the property's time zone and Google Ads in the account's, and Google says different time zones can cause discrepancies. GA4 also credits paid and organic channels by default, while each ad platform credits its own ads. In my work, reconciling tracked conversions against CRM leads is the check that catches most problems.
| Number | Owner | Why |
|---|---|---|
| Revenue | Shop or CRM | It is what the business banks |
| Leads | CRM | Includes calls and chats tags miss |
| Ad spend | Each ad platform | Billing truth |
| Sessions, key events | GA4 | One model across channels |
| Organic clicks | Search Console | Google's own count |
Can alerts replace part of the weekly report?
Short answer: They can replace the "did anything break?" part. GA4 custom insights email you when a metric crosses a threshold or behaves abnormally, and Data Studio Pro can alert on a chart. The weekly page still does the judging and ranking that alerts cannot.
GA4 lets you create up to 50 custom insights per property, evaluated hourly, daily, weekly or monthly. Hourly checks work only for web data, and you need the Editor or Administrator role. A useful first alert is "key events fell more than [x]% day on day", because a broken form shows up there before anyone reads a report.
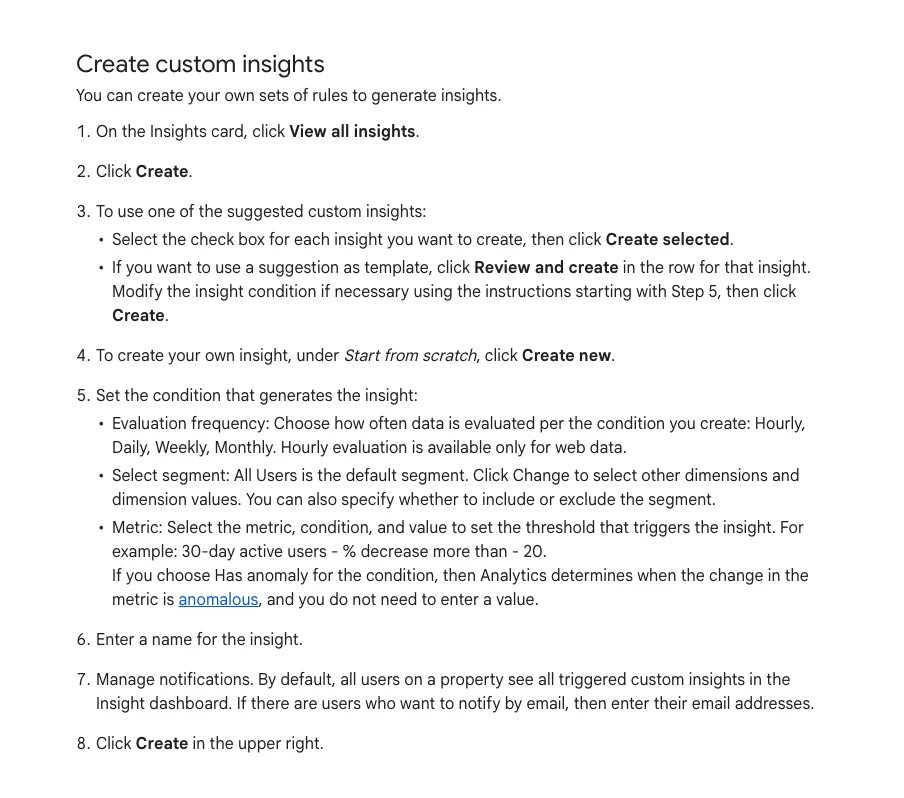
Data Studio alerts are a Pro feature, can only email people inside your organisation, and run against the report's default filters. GA4's new homepage summaries can also be sent by email, per Google's August post, but they cover one property only.
| Alert | Where | Best for |
|---|---|---|
| Custom insight | GA4, any edition | Traffic or key event drops |
| Chart alert | Data Studio Pro | A threshold on a blended chart |
| Homepage summary | GA4 (beta) | What changed since last login |
| Daily check task | Claude scheduled task | Zero leads, spend with no results |
From a UK analytics consultancy channel, November 2024. A short walk through setting custom insights and email alerts in GA4; the agency sells analytics services.
What changes for the team once it runs?
Short answer: Time moves from gathering numbers to deciding what to do about them. The Monday morning that went on exports goes on the three priorities, and the meeting starts from one agreed page instead of three versions of the truth.
Start small. Automate the headline block first and check it for a month, then add paid media, search and AI search one at a time. Resist the urge to add every metric.
Agree who owns the report, who reads it and which decisions it should trigger. A dashboard nobody acts on is decoration. I put a short human note on top of every report I send: where we are, what we are doing, what is next. It takes five minutes and it is the part people read.
Uploaded in April 2026 by one of the Google Data Cloud product leads, on a personal channel. A short tour of the renamed Data Studio home page and Conversational Analytics; no paid product beyond Google's own.
What people say on X and Reddit
Short answer: Practitioners agree on two things: the hard part is agreeing definitions before building anything, and AI summaries are arriving inside the platforms but each one only sees its own data. Google's own posts focus on dashboards built from prompts and an assistant that remembers context across tools.
| Post or thread | Where, when | Type | Point |
|---|---|---|---|
| Dashboards in Google Ads and Analytics | Google Ads Liaison account on X, 10 Aug 2026 | Vendor | Visual reports from simple prompts |
| Got access to the AI dashboard beta | A PPC practitioner on X, 14 Aug 2026 | First-hand | Old dashboard still there; testing it |
| Ask Advisor shared memory, coming soon | Google Ads on X, 24 Aug 2026 | Vendor | Goals carried across Google tools |
| GA data to LLMs through the MCP server | Google Analytics on X, 8 Jan 2026 | Vendor | Ask questions beyond standard reports |
| What do you define before building? | r/LookerStudio, Jul 2026 | First-hand | Definitions and one source of truth |
| AI insights inside the dashboard? | r/LookerStudio, Feb 2026 | Opinion, some vendor | Not native in free edition |
| Does Data Studio Pro actually exist? | r/LookerStudio, Jun 2026 | First-hand | Pro upgrade runs through Cloud billing |
| Totalling Meta and Google ad metrics | r/LookerStudio, Aug 2026 | First-hand | Blends drop days one side lacks |
The r/LookerStudio thread on definitions is the most useful: the original poster describes one person counting form fills as conversions while another includes calls and bookings. A reply adds that you should decide which platform owns each metric, not only what it means. Another thread, on first dashboards, argues for one page and four numbers before anything else.
Be careful with replies that recommend a specific connector or reporting tool: several in the AI insights thread come from accounts promoting their own product.
Videos worth watching
Short answer: Start with Google's own Google Analytics MCP videos if you plan an AI-written report, then a Data Studio tutorial for the dashboard itself. The rest cover GA4 alerts and Ask Advisor.
| Video | Channel | Date | What it covers |
|---|---|---|---|
| Introducing the Google Analytics MCP Server | Google Analytics (official) | Jul 2025 | Chat with GA4 data |
| Google Analytics MCP Setup Tutorial | Google Analytics (official) | Sep 2025 | Step-by-step setup |
| Intro to Google Cloud Data Studio, April 2026 demo | A Google Data Cloud product lead | Apr 2026 | The renamed Data Studio |
| Looker Studio Tutorial (Now 'Data Studio') | An analytics training channel | May 2025 | Build a report end to end |
| Custom insights and email alerts in GA4 | A UK analytics consultancy | Nov 2024 | GA4 alerts |
| Analytics Advisor: Chat With Your Google Analytics Data | An analytics training channel | Nov 2025 | The GA4 assistant, early look |
Where this advice is weak
Short answer: The timings are Google's typical figures, not guarantees; beta features may change or not reach your account; and nothing here has been tested against your data. Treat the setup as a starting design, then check it against your own tools for a month.
- GA4 processing times vary for large properties and during slowdowns. Google says so on the same page.
- Ask Advisor, the GA4 homepage summaries and Google Ads dashboards are betas for English-language accounts. Names and limits may change.
- Claude Code cloud scheduled tasks are a research preview. Cowork task frequencies and plan availability can change.
- There is no agreed way to measure AI search visibility. A fixed prompt set is a practical proxy, not a standard.
- I have not tested every connector mentioned here, and third-party connector quality varies.
Want a dashboard leadership actually reads?
Short answer: If the numbers disagree today, start with tracking and definitions, then automate the page. I set up measurement, reconcile GA4, ad platforms and the CRM, and build the weekly report and its checks.
My analytics and tracking service covers the measurement plan, tag fixes, the data sources and the scheduled report. Rates are on the pricing page. For prompt templates and checklists you can use yourself, see the free guides.
Sources
| Source | What it supports | Date |
|---|---|---|
| Data Studio release notes | Rename, Conversational Analytics, Pro hourly schedules, quotas | 16 Apr, 30 Jul 2026 |
| Google Cloud blog | Data Studio and Data Studio Pro editions | 11 Apr 2026 |
| Data Studio docs: scheduling | Limits, 50 recipients, email quotas | Read 17 Nov 2026 |
| Data Studio docs: alerts | Pro only, internal recipients | Read 17 Nov 2026 |
| Data Studio docs: data freshness | 12 hour default for Google sources | Read 17 Nov 2026 |
| Data Studio docs: GA connector | Subject to GA Data API quotas | Read 17 Nov 2026 |
| GA Data API quotas | 200,000 tokens per property per day | Read 17 Nov 2026 |
| GA Help: Schedule reports | Admins, 50 reports, 72 hours, PDF or CSV | Read 17 Nov 2026 |
| GA Help: Data freshness | Intervals, prior day timings, late events | Read 17 Nov 2026 |
| GA Help: Analytics Insights | 50 custom insights, email alerts | Read 17 Nov 2026 |
| GA Help: Ask Advisor | Beta, single property, English | Read 17 Nov 2026 |
| GA Help: Attribution settings | Time zone discrepancies | Read 17 Nov 2026 |
| Google blog | Homepage summaries, dashboards, benchmarking | 10 Aug 2026 |
| Google Analytics MCP server | Read tools, write behind a flag | Read 17 Nov 2026 |
| Google Ads MCP server docs | Read and partial mutate | Read 17 Nov 2026 |
| Claude Help Center | Cowork scheduled tasks | Read 17 Nov 2026 |
| Claude Code docs | Cloud scheduled tasks, research preview | Read 17 Nov 2026 |
| X and Reddit | Practitioner and vendor views | Jan to Aug 2026, see table above |
This article expands on my post on LinkedIn ↗.
FAQ
What should a weekly executive marketing dashboard include?
Five blocks on one page: headline numbers such as revenue, leads, spend and cost per lead; paid media by platform; search; AI search visibility; and three ranked priorities. Each block shows the change from last week and its source and date range.
Is Looker Studio still available?
Yes, under its old name. Google rebranded Looker Studio as Data Studio on 16 April 2026, and the paid edition is now Data Studio Pro. Existing reports carried over, and the free edition still costs nothing.
How do I schedule a report in Data Studio?
Open the report, choose Share, then Schedule delivery, add recipients, pick pages, a start time and how often it repeats. The free edition allows one schedule per report, at most daily, to up to 50 recipients; Data Studio Pro allows up to 200 schedules and hourly delivery.
Can GA4 email a weekly report automatically?
Yes. An administrator opens a report, clicks Share this report, then Schedule Email, and can send it daily, weekly, monthly or quarterly as a PDF or CSV. A property can have up to 50 scheduled reports, each active for up to 12 months.
Can Claude build the weekly marketing report without manual exports?
Yes, if it can reach your data. A Claude Cowork scheduled task runs on a cadence with your connectors, skills and plugins, and can draft the page from GA4, ad platforms and CRM exports. Keep its access read-only and have a person approve the draft before it goes to leadership.
What time should a Monday executive report send?
After the data is ready. GA4 typically has the previous day in Reports by mid afternoon in the property's time zone, so a 9am Monday report should cover the week to Saturday, or send on Tuesday. Refresh any Data Studio data sources first, because they cache for up to 12 hours.
Why do GA4, Google Ads and the CRM show different lead numbers?
They count different things in different ways. GA4 credits paid and organic channels, each ad platform credits its own ads, time zones can differ, and the CRM includes calls and chats that tags miss. Pick one owner per number and reconcile the others against it.
How do I make sure an automated report is accurate?
Write down every definition, show the source and date range under each block, and run the automated report beside the manual one for three or four weeks, explaining every difference. Fix conversion tracking first and keep a human review step.