Claude charts and diagrams are visuals Claude builds inside a conversation: flowcharts, data charts and clickable diagrams, called custom visuals and in beta since March 2026. For SEO and PPC reporting, use them to explore an export, save the good ones as artifacts, use Claude Data for refreshing dashboards, and check every total against the platform first.
It is Monday. You have a Search Console export, a Google Ads export and a client who has asked, again, for "a summary, not a list". Claude can now turn those files into a chart or a flowchart inside the chat, and keep the good ones as shareable pages. This guide shows which Claude visual tool fits each SEO and PPC reporting job, and the checks that stop a confident chart from showing the wrong number. If you want it set up for your team, see my Claude consultant service.
TL;DR
Claude draws charts and diagrams in the chat. Anthropic calls them custom visuals: a beta on every plan since 12 March 2026, in Cowork on paid plans since 22 April 2026, on web and desktop only (Claude Help Center).
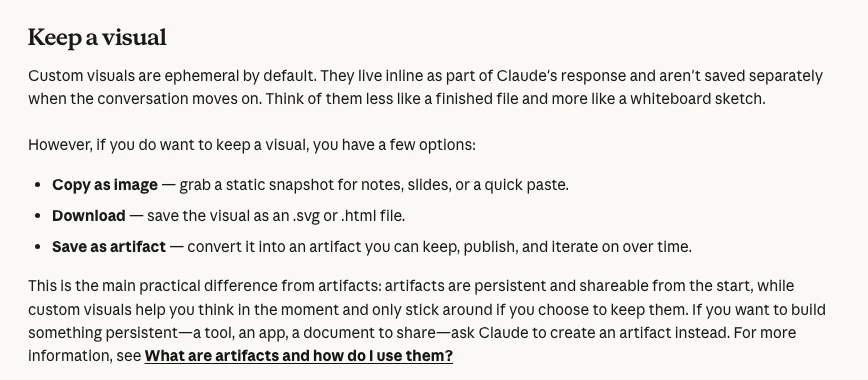
They are temporary. To keep one, copy it as an image, download it as .svg or .html, or save it as an artifact. Use Claude Data when a chart should refresh from a data source.
For SEO and PPC reports, check the source first. Search Console tables show at most 1,000 rows, so totals rarely equal the sum of rows. GA4 data can change for 24 to 48 hours.
Never send a chart you have not reconciled. Match totals, date range, currency and the conversion column against the platform before a client sees it.
What are Claude charts and diagrams?
Short answer: They are visuals Claude builds inside its reply: flowcharts, bar and line charts, comparisons and clickable diagrams. Anthropic calls the feature custom visuals. It launched in beta on 12 March 2026 for all plans, reached Cowork on paid plans on 22 April 2026, and works on web and desktop, not the mobile apps.
You do not need to switch anything on. Claude decides when a visual would help, or you ask directly with phrases such as "chart this data" or "draw this as a diagram". You can click inside the visual, move sliders, open it full screen and ask for changes in plain English.
These are not generated images. Anthropic's launch post says the visuals are built with code, which is why labels and numbers can be edited and why a chart can respond to a click. It also says they are temporary: they change or disappear as the conversation moves on.
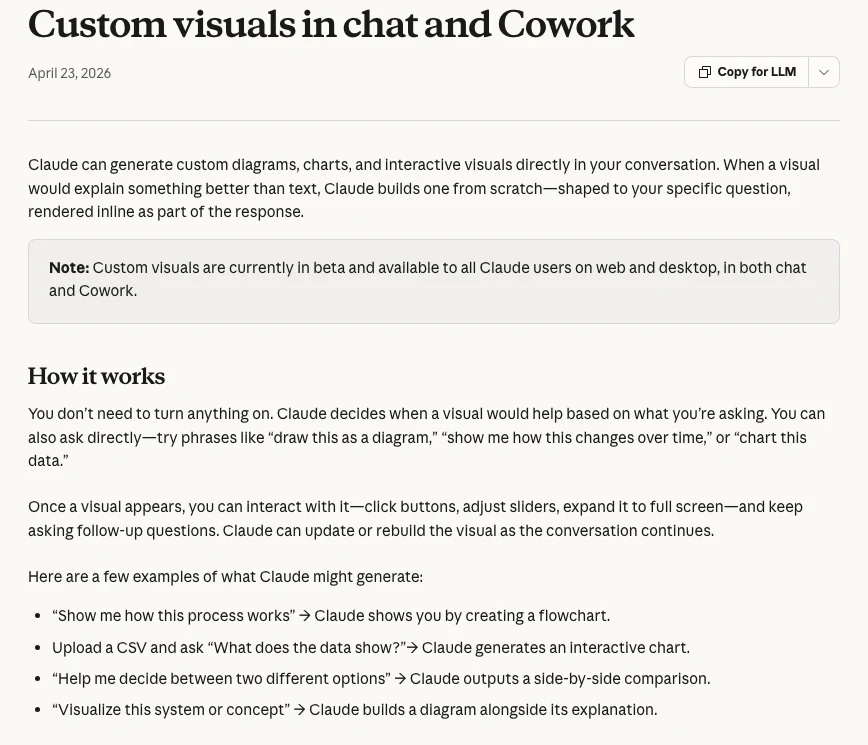
Made by Anthropic's Claude channel on 12 March 2026 for the launch. It shows the feature; it promotes Claude itself.
Which Claude visual tool should you use for marketing reports?
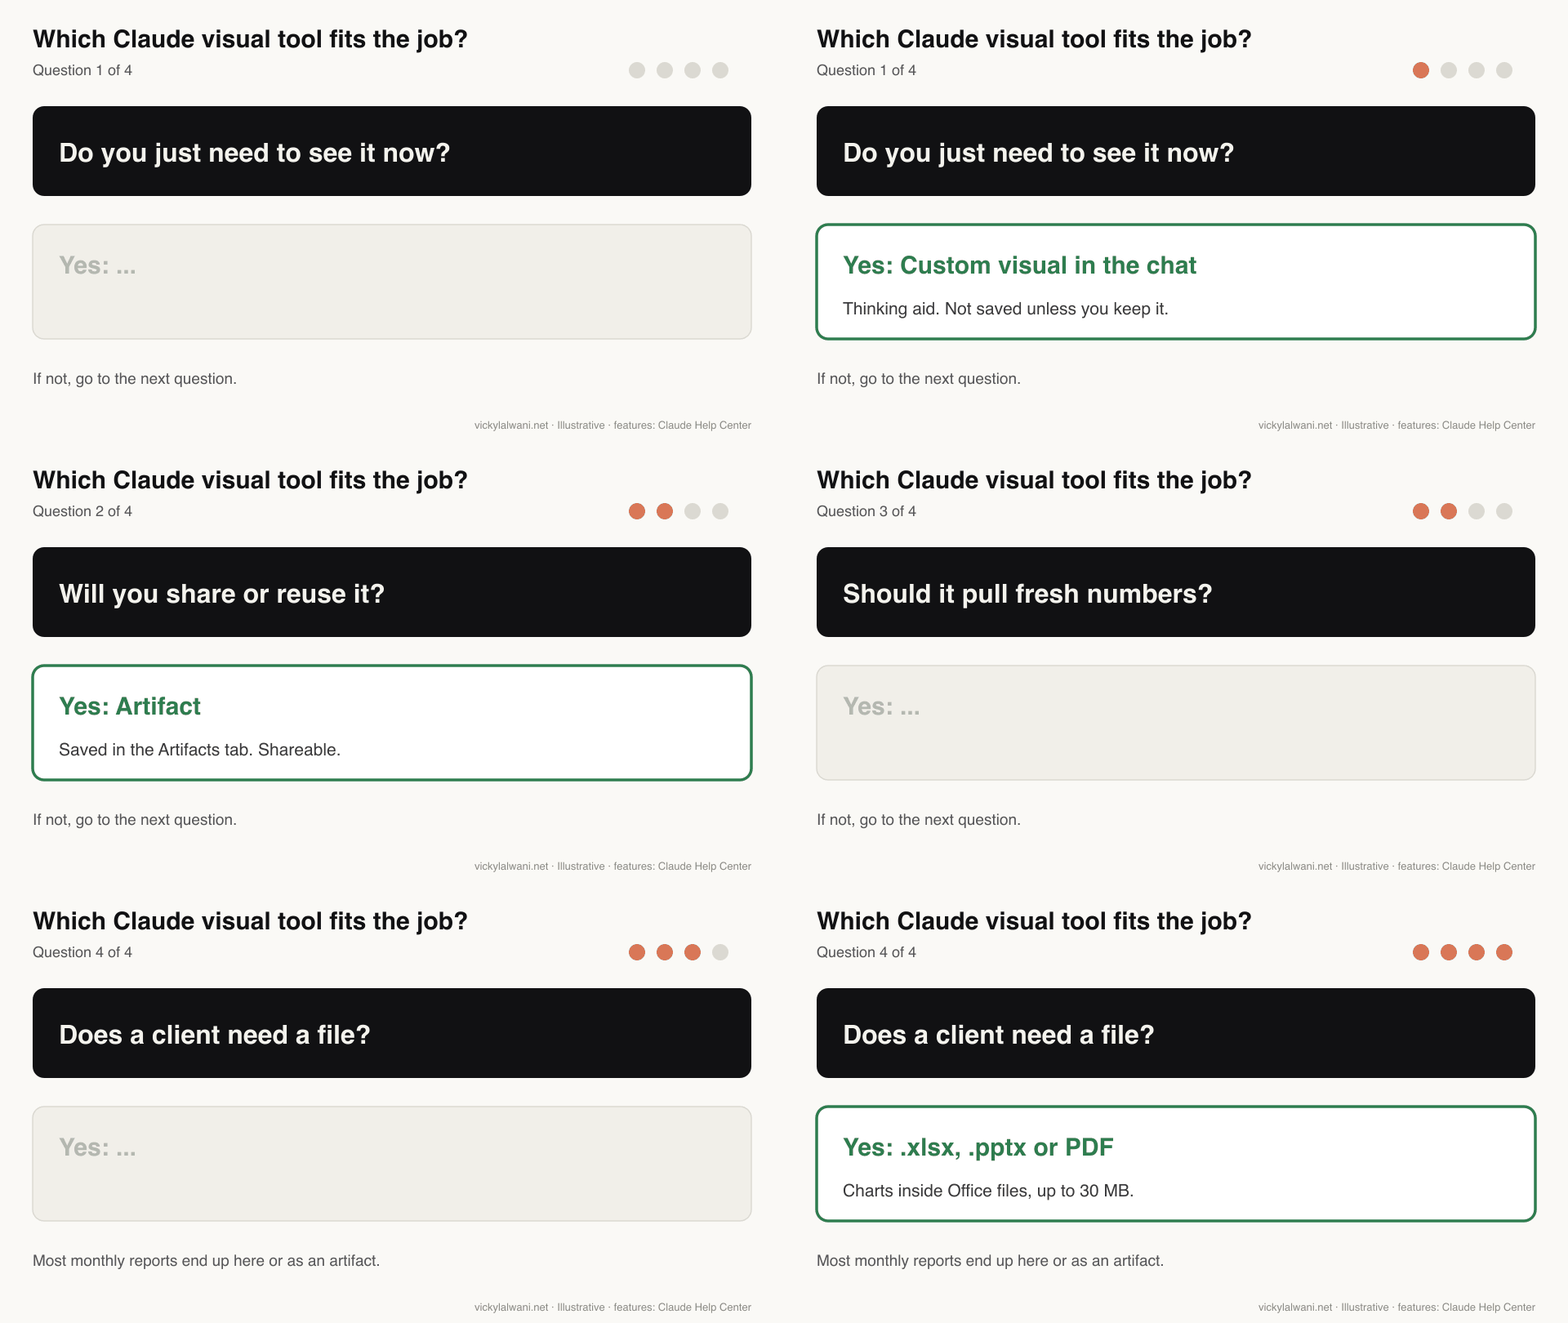
Short answer: Use a custom visual to think something through, an artifact when you will share or reuse the chart, Claude Data when it should refresh from a connected source, and an Excel or PowerPoint file when the client needs a file. Most monthly SEO and PPC reports end as an artifact or a file.
| Tool | Best for | Saved? | Live data? |
|---|---|---|---|
| Custom visual | Exploring an export | Only if you keep it | No |
| Artifact | A report page you share | Yes, Artifacts tab | With connectors |
| Claude Data | Dashboards from a source | Yes | Refreshes on open |
| Office files | Client decks and sheets | Download, 30 MB max | No |
| Claude Code artifact | Output of a script run | Yes, private link | With connectors |
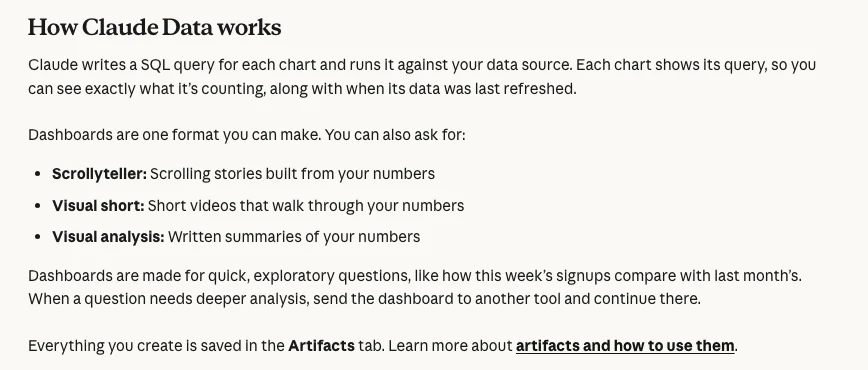
The difference that matters most is persistence. Anthropic describes a custom visual as closer to a whiteboard sketch than a finished file. An artifact is saved to the Artifacts tab, can be edited later and can be shared. Claude Data (renamed from Claude Dashboards) writes a query for each chart, runs it against your source and shows when it was last refreshed.
If you build reports in slides already, the monthly PPC report in Google Slides workflow pairs well with this: let Claude draft the charts, then keep the deck format your clients know.
Which Claude plans include charts, artifacts and dashboards?
Short answer: Custom visuals and basic artifacts are on all six plans, including Free. Claude Data, connecting apps to an artifact, and the Sheets and Whiteboards betas need Pro or above. The Motion beta (animated charts) is only on Team and Enterprise. Artifacts also need "Create and edit files" turned on in settings.
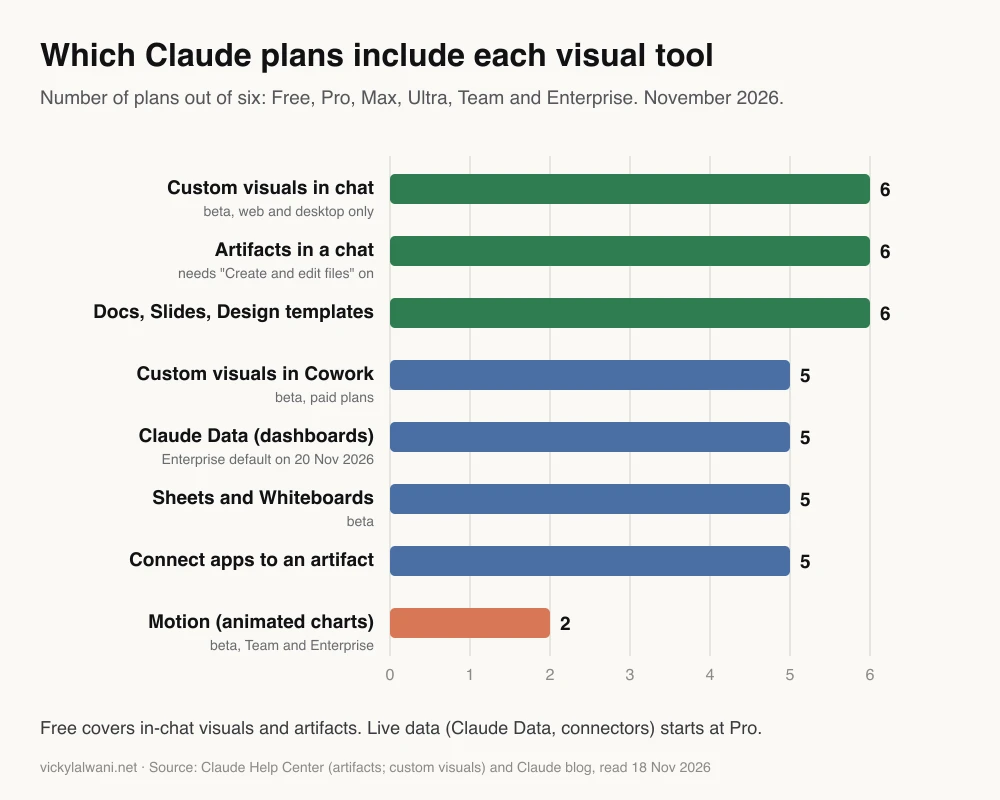
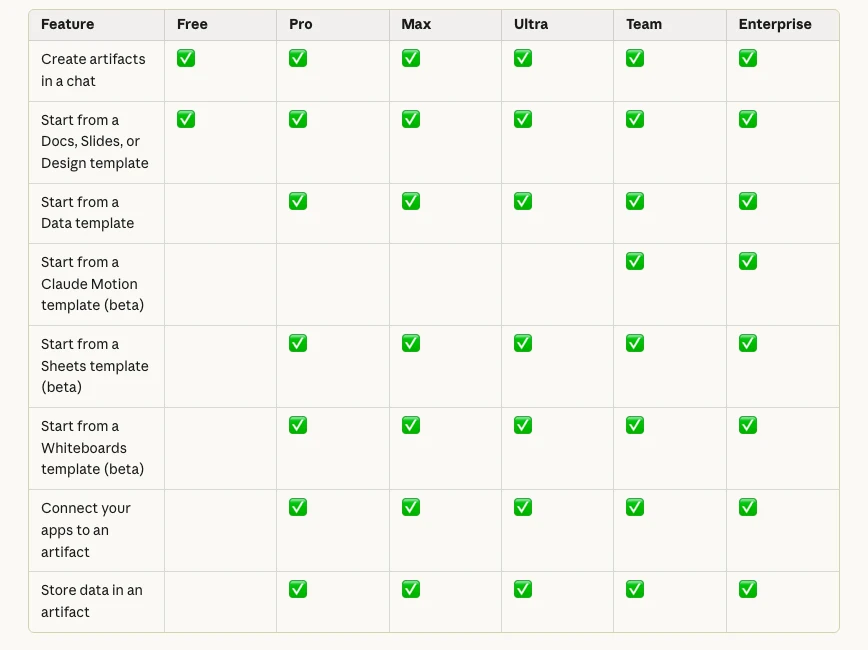
Two dates are worth knowing on Enterprise plans. The Data template turns on by default on 20 November 2026 unless an owner has saved a setting, and the Docs, Slides and Design templates did the same on 15 October 2026 (Claude Help Center). If a colleague cannot see an option you can, the plan or an admin setting is the usual reason.
How do you chart Search Console data with Claude?
Short answer: Export the Performance report, upload the file and ask for one chart that answers one question, such as clicks by query group or CTR by position band. Then check the total against the report. Search Console tables show at most 1,000 rows and omit rare queries, so the chart total is often higher than the sum of rows.
That last point catches people out. Google's About Search Console data page says the chart totals can be higher than the sum of table rows because tables are capped at 1,000 rows and privacy filtering drops rare queries. It also says values shown as ~ or - become zeros in a download. A chart built from the export is a chart of the export, not of all your search traffic.
| SEO chart | Data you need | Check before sharing |
|---|---|---|
| Clicks by query cluster | Queries export | Rows capped at 1,000 |
| CTR by position band | Queries export | Zeros from ~ values |
| Top page groups | Pages export | Same dates as last month |
| Branded vs non-branded | Queries plus brand list | Misspellings counted |
| Site section diagram | Crawl export | Orphan pages shown |
For larger sites, pull the data through the Search Console API, which pages through 25,000 rows at a time, or keep a Claude Code script that does it for you. If you are still building the keyword groups, the keyword research with Claude workflow produces clusters that chart cleanly. For SEO strategy behind the charts, see my SEO consulting.
I have attached a Search Console Performance export (Queries tab) for the last 28 days and the same 28 days last year.
Audience: a business owner who wants to know if SEO is growing.
1. Group queries into branded and non-branded using this brand list: [brand names].
2. Draw one bar chart: clicks by group, this year vs last year.
3. Under the chart, write three plain sentences on what changed.
4. Show the total clicks in the file and remind me that Search Console tables are capped at 1,000 rows, so totals may differ from the report.
Do not estimate anything that is not in the file.
How do you chart Google Ads and Meta ads data with Claude?
Short answer: Export the campaign or search terms report with the date range in the file name, upload it and ask for one chart per decision: spend against conversions by week, cost per conversion by campaign, or wasted spend by search term theme. Use the conversions column your bidding uses, and note how fresh the data is.
Freshness changes what a chart says. Google Ads data freshness lists most metrics, such as clicks, impressions, cost and last-click conversions, as refreshed hourly, while conversions under other attribution models can take hours longer. In GA4, Google says processing can take 24 to 48 hours and data may change in that time. A chart of "yesterday" made at 9am can be wrong by lunchtime.
| PPC chart | Decision it supports | Common mistake |
|---|---|---|
| Spend vs conversions by week | Is spend working? | Mixing conversion columns |
| Cost per conversion by campaign | Where to move budget | Ignoring low volume |
| Search term themes | New negatives | Partial date range |
| Budget pacing line | Over or under spend | Wrong month length |
| Google vs Meta results | Channel mix | Different attribution |
Claude can also read the data directly. My guide to live ads dashboards covers the Google Ads and Meta connectors, approvals and refresh rules in depth, and the cross-channel report explains why Google and Meta numbers never add up. If you want the account itself looked after, see Google Ads management or Meta ads management.
Attached: a Google Ads campaign report, 1 to 31 October, columns Campaign, Cost, Conversions, Conv. value.
1. Draw a bar chart of cost per conversion by campaign, highest first.
2. Grey out any campaign with fewer than 10 conversions and label it "low volume".
3. Use the currency in the file and show the total cost and total conversions under the chart.
4. List anything in the file that looks inconsistent (blank rows, totals that do not add up).
Do not calculate ROAS unless I ask, and show every formula you use.
Which diagrams help SEO and paid search work?
Short answer: Flowcharts that show how things connect are the most useful: the path from a form to a Google Ads conversion, how pages link inside a site section, how campaigns and ad groups are structured, and who approves what. A diagram exposes a missing step faster than a paragraph does.
| Diagram | What it shows | Who it helps |
|---|---|---|
| Tracking path | Form to GA4 to Google Ads | Analyst, developer |
| Site section map | Hubs, child pages, links | SEO, content team |
| Campaign structure | Campaigns, ad groups, budgets | PPC manager, client |
| Approval flow | Who signs off changes | Agency, client |
| Funnel view | Ad, page, lead, sale | Business owner |
The tracking path is the one I would draw first. Describe it step by step: the form, the thank-you event, the tag that fires, the GA4 key event and the imported Google Ads conversion. When Claude draws it, a step you forgot shows up as a gap. If the gap is real, my analytics and tracking service fixes it.
Draw a flowchart of how a lead is tracked on my site. Steps in order:
1. Visitor submits the contact form on /contact.
2. The site shows /thank-you.
3. Google Tag Manager fires a GA4 event called generate_lead.
4. generate_lead is marked as a key event in GA4.
5. The key event is imported into Google Ads as a conversion.
Mark any step that has no way to check it is working, and list what I should test for each step.
How do you get a good chart from Claude first time?
Short answer: Say who will read it and what decision it supports, give it the real data rather than a topic, name the chart type and axes, and change one thing per message. Then compare the total with the source file before you keep the chart.
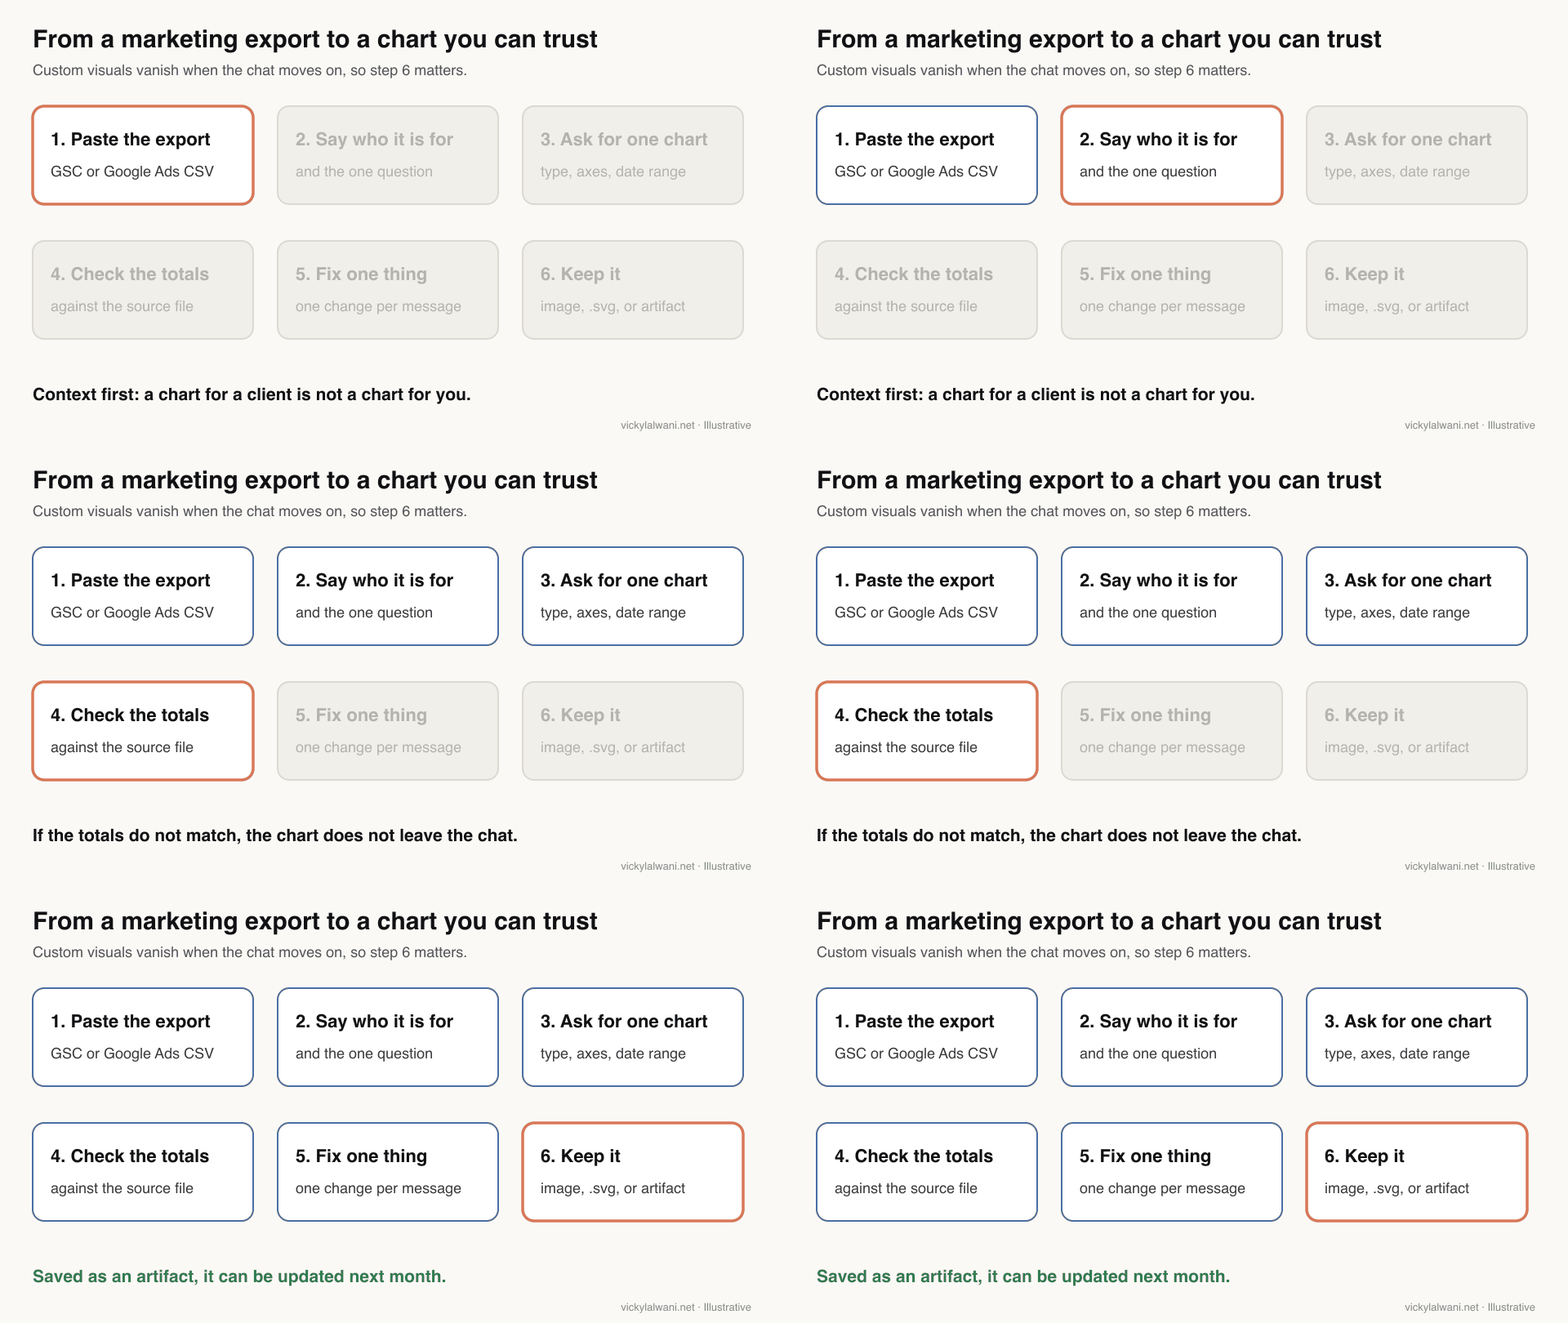
- Purpose: "for a client who wants to know if paid search is paying back" beats "make a chart".
- Real content: the export, the steps or the categories, not a description of them.
- Type and axes: bar, line, flowchart or comparison, plus what goes on each axis and the date range.
- One change at a time: so you can see what each instruction did.
- Check: totals, dates and currency against the platform.
Anthropic's own tips agree with most of this. The help page suggests rephrasing if you get text instead of a visual, says Opus models do best on complex visuals, and notes that Claude will remember a style preference such as brand colours.
How do you check a Claude chart before a client sees it?
Short answer: Reconcile it. The total in the chart should match the platform for the same dates, the conversion column should be the one you report on, the currency and time zone should match the account, and any axis that does not start at zero should say so. If one check fails, the chart stays in the chat.
| Check | Why it fails | Fix |
|---|---|---|
| Totals match source | Rows dropped or capped | Show total from file |
| Same date range | Partial last day | Name exact dates |
| Right conversions | All vs primary conversions | Name the column |
| Currency and time zone | Mixed accounts | One account per chart |
| Maths shown | Model guessed a ratio | Ask for formulas |
| Axis honest | Scale exaggerates change | Start at zero or label |
Practitioners say the same. A widely upvoted reply on r/PPC warns not to let a model do the maths for ROAS or CPA without checking. My own habit is the one I use for any report: clients want a summary, not a list, with a benchmark behind every label, and nothing goes out without approval and a short human note on where things stand and what happens next.
Anthropic also says visual quality and complexity will vary while the feature is in beta, and that Claude may not always draw a visual when you expect one (limitations). Treat the chart as a draft until you have checked it.
Can you share Claude charts with clients?
Short answer: Yes, but not the in-chat version directly. Copy a custom visual as an image, download it as .svg or .html, or save it as an artifact and share that. Shared chats only show visuals to signed-in viewers on web and desktop, and visuals made in Cowork do not render through a share link.
For live pages, check whose data a viewer sees. Anthropic's Claude Code artifacts docs say a page that calls connectors uses the viewer's own connections, so a client without the connector sees the page without its live sections. Claude Data's live sharing (beta) works differently and is covered in my guide to Claude Sheets, Whiteboards and Data.
For most client work I would export a static image or file for the monthly report and keep any live page internal. A static chart cannot change after the client has read it.
Made by Anthropic's Claude channel on 8 October 2026, when Dashboards (now Claude Data) launched. A product announcement.
Which videos show Claude charts in action?
Short answer: Start with Anthropic's own launch videos for what the features do, then watch a practitioner build an ads dashboard to see the setup work involved. Several practitioner videos sell a connector or template, so treat their speed claims as marketing.
| Video | Channel | Date | What it covers |
|---|---|---|---|
| Claude can now show you | Claude (official) | 12 Mar 2026 | Custom visuals launch |
| Introducing Claude Dashboards and Claude Motion | Claude (official) | 8 Oct 2026 | Live dashboards |
| Introducing Claude Whiteboards, Sheets, and Data | Claude (official) | 10 Nov 2026 | Claude Data rename |
| New Claude Visuals Explained in 4 Minutes | An AI news channel | 19 Mar 2026 | Feature walkthrough |
| Google Ads, Meta Ads and GA4 dashboard with Claude | A reporting tool vendor | 24 Apr 2026 | Ads dashboard build |
| Claude Dashboards and Motion for marketing data | A marketing data vendor | 9 Oct 2026 | Marketing dashboards |
What people say on X and Reddit
Short answer: Anthropic's posts focus on what the features can do. Practitioners focus on trust: reporting problems are usually about agreed definitions and believable numbers, not chart design, and several warn against letting a model calculate ratios unchecked.
| Post | Date | Point | Type |
|---|---|---|---|
| Claude on X | 12 Mar 2026 | Charts and diagrams in chat, all plans | Vendor |
| Claude on X | 22 Apr 2026 | Visuals arrive in Cowork | Vendor |
| Claude on X | 8 Oct 2026 | Dashboards show each chart's query | Vendor |
| A performance marketer at Anthropic | 24 Mar 2026 | Google Ads skills via a Cowork plugin | Vendor |
| An AI automation creator | 1 Apr 2026 | Google Ads data to an HTML dashboard | Opinion |
| Reddit thread | Date | Recurring theme | Type |
|---|---|---|---|
| r/PPC: client reporting got worse | 23 Mar 2026 | Reporting is a trust problem | First-hand |
| r/PPC: Cowork and Code use cases | 14 Apr 2026 | Do not let it do the maths | First-hand |
| r/PPC: Cowork in performance marketing | 19 Apr 2026 | Claude surfaces, a human decides | Opinion |
| r/PPC: a scripted daily report | 21 Jun 2026 | An email beats a dashboard | First-hand |
| r/LookerStudio: define metrics first | 30 Jul 2026 | Agree what "conversion" means | Opinion |
The X posts were checked through X's embed service on 18 November 2026. The Reddit threads were read through the Arctic Shift archive; I credit communities, not users. One X post comes from an Anthropic employee and one from a creator selling templates, so both are marked accordingly.
Where this advice is weak
Short answer: Custom visuals are still a beta and Anthropic changes plan details often, so check the linked help pages before relying on a setting. I have not measured how much time Claude charts save, and the social evidence is anecdotal.
- Facts were read on Anthropic and Google pages on 18 November 2026. Plan names, defaults and limits may change.
- The plan chart counts whether a feature is on a plan, not how much you can use it. Usage limits differ by plan.
- Chart quality varies by model and prompt; Anthropic says so itself. The prompts here are starting points, not tested templates.
- The PPC and SEO checks are general. Your accounts may use different conversion settings or attribution models.
Want Claude reporting set up for your SEO and PPC accounts?
Claude charts remove the copy and paste between an export and a slide. They do not decide which number matters or notice that tracking broke last week. If you want Claude set up so your team gets checked, client-ready charts from Search Console, Google Ads and Meta, my Claude consultant service covers the setup and training, and AI automation covers scheduled reports. For the accounts behind the charts, see SEO consulting and Google Ads management. Rates are on the pricing page.
Sources
| Source | What it supports | Date | Link |
|---|---|---|---|
| Claude Help Center | Custom visuals: beta, web and desktop, keep options, limits | Read 18 Nov 2026 | Custom visuals |
| Claude blog | Launch 12 Mar 2026; Cowork 22 Apr 2026 | 12 Mar 2026 | Claude builds visuals |
| Claude Help Center | Artifacts, templates and plans | Read 18 Nov 2026 | What are artifacts |
| Claude Help Center | Claude Data queries and refresh | Read 18 Nov 2026 | Claude Data |
| Claude Help Center | Office files with charts, 30 MB | Read 18 Nov 2026 | Create and edit files |
| Claude Code docs | Artifacts, connectors use viewer's account | Read 18 Nov 2026 | Artifacts in Claude Code |
| Search Console Help | 1,000-row tables; totals; zeros | Read 18 Nov 2026 | About Search Console data |
| Search Console API | Paging 25,000 rows | Read 18 Nov 2026 | Getting all your data |
| Google Ads Help | Hourly freshness, conversion delays | Read 18 Nov 2026 | Data freshness |
| Google Analytics Help | 24 to 48 hours processing | Read 18 Nov 2026 | Data freshness |
| YouTube, X, Reddit | Videos and practitioner views | 2026 | Linked in tables |
This article expands on my post on LinkedIn ↗.
FAQ
Can Claude make charts and diagrams?
Yes. Claude can draw charts, flowcharts and interactive diagrams inside a chat, a beta feature Anthropic calls custom visuals. It works on Claude web and desktop on all plans, and in Cowork on paid plans, but not in the iOS or Android apps.
Are Claude charts saved automatically?
No. Custom visuals are temporary and disappear as the conversation moves on. To keep one, copy it as an image, download it as an .svg or .html file, or save it as an artifact in the Artifacts tab.
Is Claude chart making free?
Custom visuals and basic artifacts are available on the Free plan. Claude Data dashboards, connecting apps to an artifact and the Sheets and Whiteboards betas need a paid plan, and Motion needs Team or Enterprise.
Can Claude chart my Search Console data?
Yes. Upload a Performance report export and ask for one chart per question. Remember that Search Console tables show at most 1,000 rows and omit rare queries, so totals from the export will not always match the report.
Can Claude build a Google Ads report with charts?
Yes, from an export or through a connector. Ask for one chart per decision, name the conversion column and date range, and check the totals against Google Ads before sharing, because a model can get ratios such as ROAS wrong.
What is the difference between a Claude custom visual and an artifact?
A custom visual is a temporary chart or diagram inside a reply, meant to help you understand something now. An artifact is saved, can be edited later and can be shared or published.
What is Claude Data?
Claude Data, previously Claude Dashboards, builds dashboards and data stories from a connected data warehouse or app. Each chart shows the query behind it and when it was last refreshed, and it is available on Pro plans and above.
Can I put Claude charts in a client presentation?
Yes. Copy the visual as an image or ask Claude to create a PowerPoint or Excel file with the charts inside. Check every number and label against the source data first, because the chart is only as accurate as the data and the prompt.